
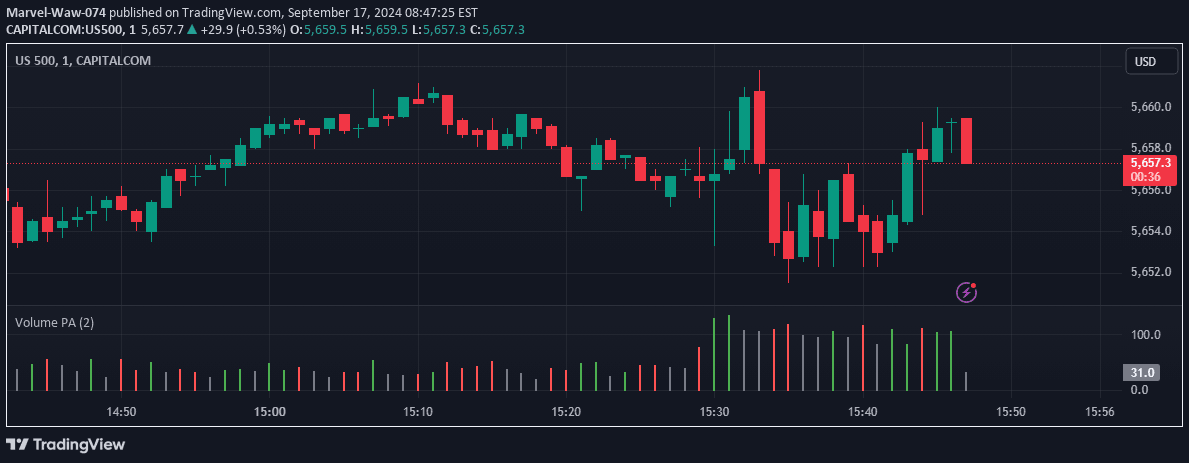
A custom volume histogram that reveals trading volume dynamics by color-coding bars based on price action and comparative volume levels against previous bars.
Explore complementary indicator rolesHow it works
The volume histogram dynamically changes color based on the current bar's price action, indicating bullish or bearish momentum. When the closing price is higher than the opening price, the bar turns green, signaling potential bullish sentiment. Conversely, a red bar indicates a bearish movement with the closing price lower than the opening price.
The histogram also incorporates a volume comparison mechanism where bars are greyed out if the current volume is lower than the volumes of a user-specified number of previous bars. This feature helps traders quickly identify potential volume weakness or divergence from recent trading activity.
Why it may be useful
Traders rely on volume analysis to confirm price movements and validate potential trend strength or reversals. By color-coding bars and comparing current volume against recent historical volumes, this indicator provides a quick visual representation of market dynamics and potential momentum shifts.
The customizable nature of the histogram allows traders to adapt the volume comparison to their specific trading style and timeframe. This flexibility enables more nuanced volume analysis, helping traders make more informed decisions about market entry and exit points.
When to explore it
This volume histogram is most effective during periods of active trading with significant price movements and volume fluctuations. It works best in markets with clear trending or volatile conditions where volume can provide meaningful insights into market sentiment and potential price direction.
Traders should use this indicator in conjunction with other technical analysis tools to confirm signals and reduce false positives. It is particularly useful for short-term trading strategies like scalping and day trading, where quick volume and price action assessments are crucial for making rapid trading decisions.
Keep exploring
What we’ve verified
Access, alerts and repainting behaviour have not been independently verified for this indicator. Check the creator’s current publication and settings.
General descriptions and classifications are recovered research. Verified details above identify the specific checks we have completed. Check the creator’s current publication for later changes.



