
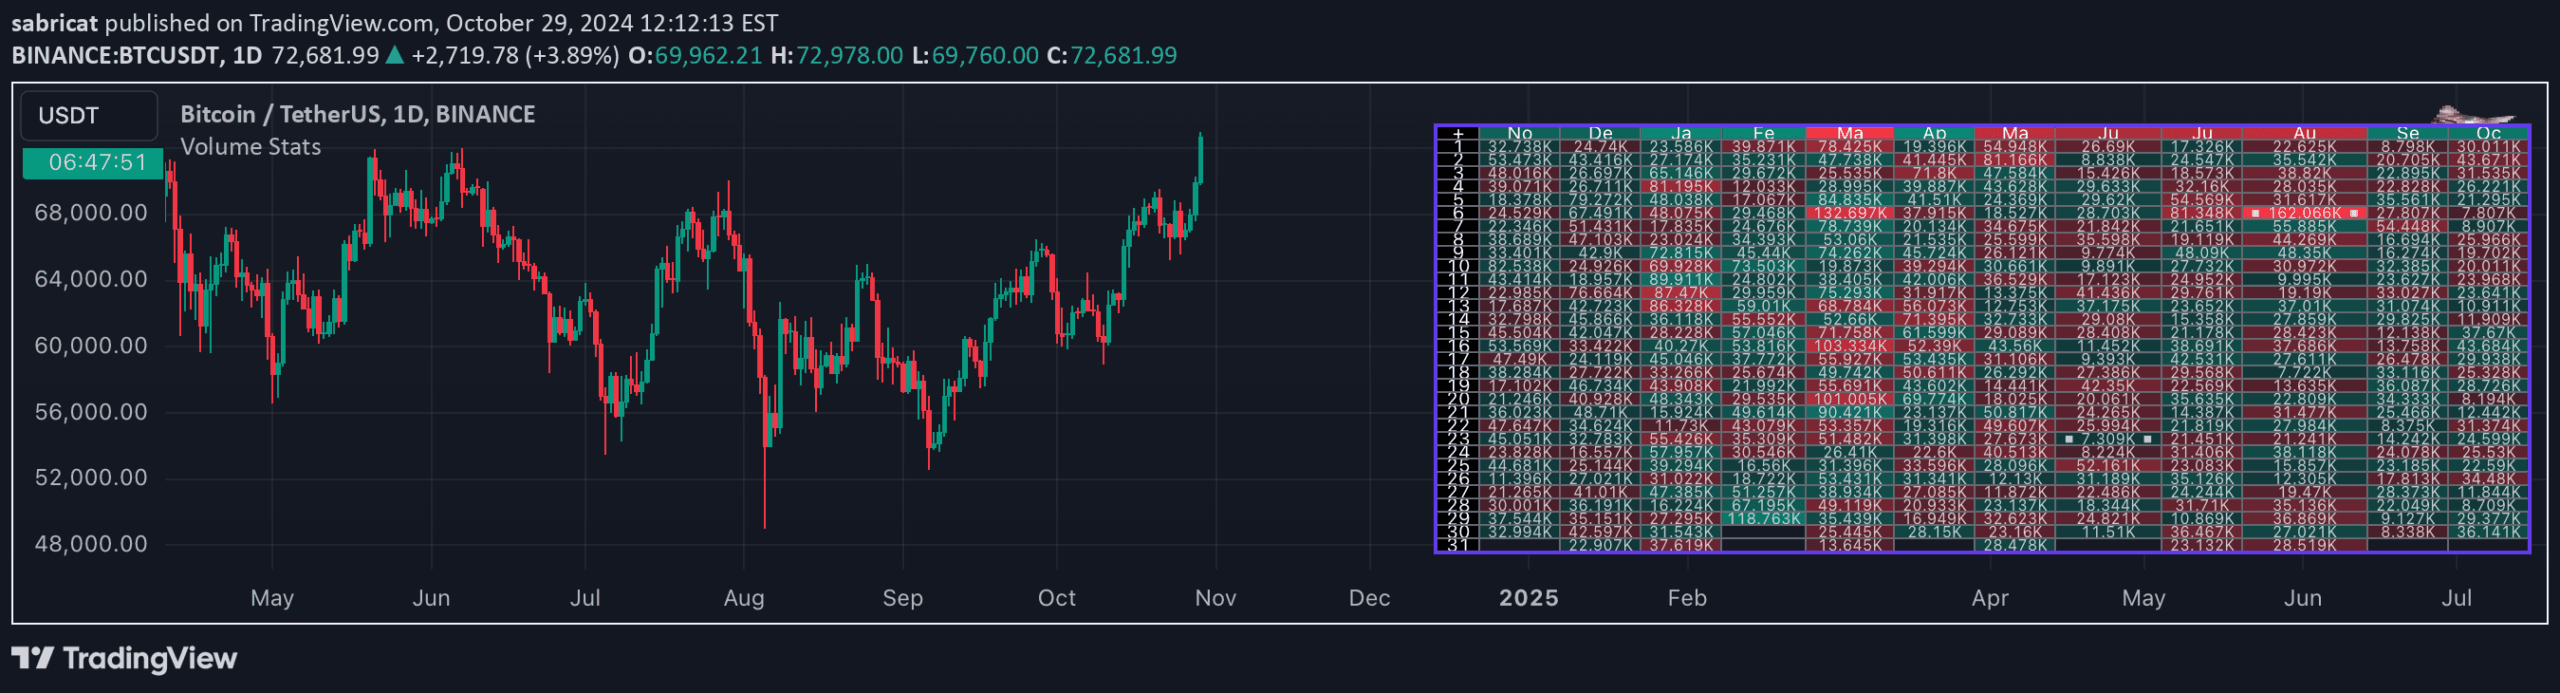
A comprehensive volume analysis tool that displays daily and monthly trading volume statistics, offering insights into market sentiment and volume distribution across the year.
Explore complementary indicator rolesHow it works
The Volume Stats indicator creates a detailed table mapping volume data across each day and month of the year. It calculates volume percentages relative to total yearly and monthly volumes, allowing traders to visualize volume distribution through color-coded cells and statistical breakdowns.
The indicator provides flexibility in displaying volume data, with options to view current or previous year's statistics, select cell data presentation, and customize color themes. Users can toggle between showing raw volume or percentage values, and highlight minimum and maximum volume days within monthly or yearly contexts.
Why it may be useful
Volume analysis is crucial for understanding market dynamics and confirming price movements. This indicator offers traders a comprehensive view of trading activity, helping them identify periods of significant market participation and potential trend strength or weakness.
By presenting volume data in an intuitive, color-coded format, traders can quickly recognize patterns in market sentiment, compare monthly performance, and gain insights into potential trading opportunities that might not be immediately visible through traditional volume indicators.
When to explore it
The Volume Stats indicator is most effective for traders seeking a detailed, systematic approach to volume analysis across different timeframes. It works best when used in conjunction with other technical analysis tools to confirm trend strength, potential reversals, and market sentiment.
Traders can leverage this tool during periods of market transition, when understanding volume distribution can provide critical insights into potential future price movements. It is particularly useful for day and swing traders who want to develop a nuanced understanding of market participation throughout the year.
Keep exploring
What we’ve verified
Access, alerts and repainting behaviour have not been independently verified for this indicator. Check the creator’s current publication and settings.
General descriptions and classifications are recovered research. Verified details above identify the specific checks we have completed. Check the creator’s current publication for later changes.



