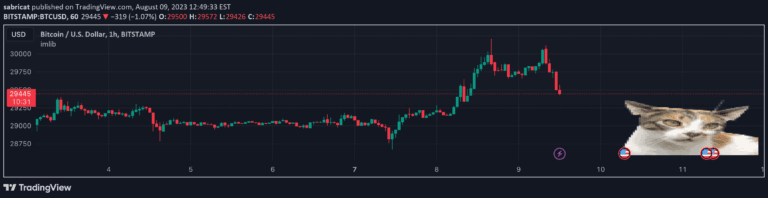
Hourly Midline
A middle line indicator for hourly candles that helps traders identify the central point of price action. Can be customized with different calculation methods and visual settings.
Explore 11,183 indicators. Filter beyond the obvious.
Discover the tools that fit the way you trade.
11,183 tools to explore
A middle line indicator for hourly candles that helps traders identify the central point of price action. Can be customized with different calculation methods and visual settings.
A comprehensive volume analysis tool that displays daily and monthly trading volume statistics, offering insights into market sentiment and volume distribution across the year.
An hourly midline indicator that displays high, middle, and low levels of candles across different timeframes, offering flexible level visualization and optional line chart tracking.
An advanced pattern recognition indicator that identifies similar historical price action segments and predicts potential future price movements by comparing price coefficients across different time periods.
A PineScript tool for generating and visualizing 2D fractals using a table-based display method with customizable resolution and fractal type selection.
A comprehensive volume calendar indicator displaying monthly volume data, tracking volume changes, spikes, and market sentiment across multiple timeframes and customizable settings.
A trading recommendation indicator that analyzes analyst opinions from Tradingview, displaying ratings like Buy, Sell, or Hold through bar, pie chart, or table visualizations.
A Pine Script library for displaying images in trading scripts using table objects, allowing image rendering with customizable size and aspect ratio within script limitations.
A custom dictionary-like data structure in Pine Script that allows storing and retrieving key-value pairs of different types with flexible methods for data management.
Likes, views, and comments are historical TradingView snapshots. They describe attention, not trading performance.