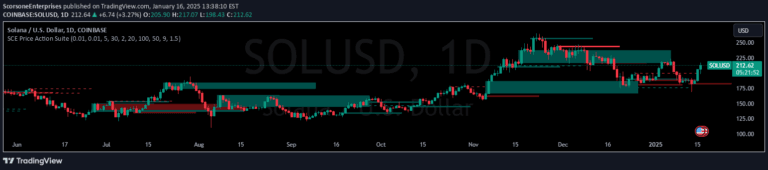
An advanced pattern recognition indicator that identifies similar historical price action segments and predicts potential future price movements by comparing price coefficients across different time periods.
Explore complementary indicator rolesHow it works
The indicator analyzes price action by calculating a unique coefficient for each candle within a specified length of historical data. It searches through a limited lookback window of up to 5000 candles to find the segment with the most similar price coefficient to the current price pattern.
Once the most similar historical segment is identified, the indicator highlights both the current and the matched historical price areas. It then attempts to predict future price movement by comparing the current price trajectory with the price progression immediately following the matched historical segment.
Why it may be useful
This indicator provides traders with a sophisticated method of identifying recurring price patterns that might signal potential future market movements. By mathematically comparing price coefficients, it offers a more objective approach to pattern recognition compared to traditional visual pattern analysis.
The tool helps traders anticipate potential price directions by leveraging historical price similarities, allowing for more informed trading decisions. Its ability to quantify and compare price action across different time segments can reveal hidden market dynamics that might not be immediately apparent through standard technical analysis methods.
When to explore it
The indicator is most effective on smaller timeframes where price variations are relatively consistent and not extremely volatile. It works best in markets with repetitive price behaviors, such as forex, cryptocurrency, and some stock markets where historical patterns tend to rhyme.
Traders should use this tool as a supplementary analysis method, combining its insights with other technical indicators and fundamental analysis. It is particularly useful for traders seeking a data-driven approach to identifying potential trade opportunities based on historical price action similarities.
Keep exploring
What we’ve verified
Access, alerts and repainting behaviour have not been independently verified for this indicator. Check the creator’s current publication and settings.
General descriptions and classifications are recovered research. Verified details above identify the specific checks we have completed. Check the creator’s current publication for later changes.