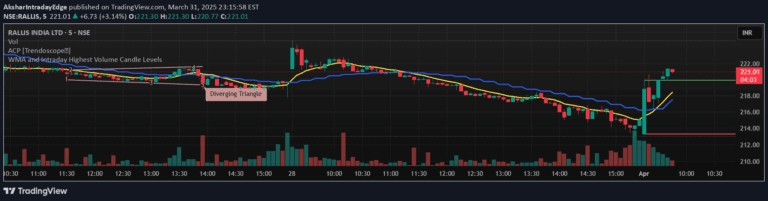
A trading strategy combining Volatility Contraction Pattern (VCP) and Pocket Pivots to identify potential breakout opportunities by analyzing price consolidation and volume surges.
Explore complementary indicator rolesHow it works
The Volatility Contraction Pattern (VCP) identifies price consolidation periods characterized by progressively tighter price ranges and decreasing volume. Traders look for a series of narrowing price bars that compress the stock's trading range. The Pocket Pivot component monitors volume during these consolidation phases, seeking significant volume increases that suggest potential institutional buying.
When price breaks out of the tight consolidation zone with increased volume, it signals a potential trend continuation or reversal. The strategy combines visual price pattern analysis with volume confirmation to detect high-probability trading setups
Why it may be useful
This strategy provides traders with a systematic approach to identifying potential breakout opportunities. By combining price contraction patterns with volume analysis, traders can filter out low-probability trades and focus on setups with higher potential for significant price movement.
The method helps traders spot early entry points before major price trends develop. It reduces emotional trading by providing a structured framework for trade selection. The approach helps traders understand market dynamics and institutional activity through volume and price interactions
When to explore it
The VCP and Pocket Pivot strategy works best in stocks with clear trend potential and sufficient trading volume. It is most effective in stocks showing strong fundamental characteristics and institutional interest. Traders should apply this strategy in markets with moderate to high volatility, avoiding extremely choppy or range-bound conditions.
The method is particularly useful in growth stocks and sectors experiencing significant momentum. It requires careful interpretation of price and volume patterns, making it more suitable for experienced traders who understand market dynamics
Keep exploring
What we’ve verified
Access, alerts and repainting behaviour have not been independently verified for this indicator. Check the creator’s current publication and settings.
General descriptions and classifications are recovered research. Verified details above identify the specific checks we have completed. Check the creator’s current publication for later changes.