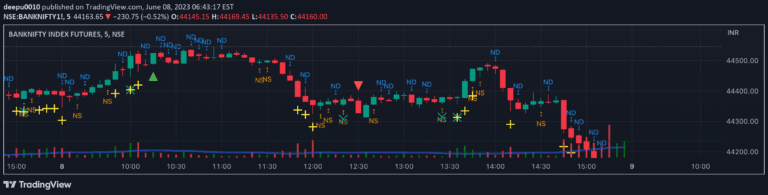
A custom volume-based candle chart indicator that analyzes price fluctuations by tracking cumulative volume, counter changes, and trend strength through unique visual representations.
Explore complementary indicator rolesHow it works
The indicator starts by accumulating the volume of all trading bars and continuously calculating a dynamic counter by dividing the accumulated volume by 2. As the counter changes, the system tracks the duration and calculates the slope and angle of volume transitions.
Based on these calculations, the indicator generates custom candles that visually represent volume changes and price movements. It also computes simple moving averages (SMA) to smooth price trends and compares the upper and lower candle lengths to provide additional trend insights.
Why it may be useful
This indicator offers traders a sophisticated visual tool for understanding market dynamics beyond traditional price charts by integrating volume analysis with trend visualization. By transforming raw volume data into meaningful graphical representations, traders can gain deeper insights into market momentum and potential trend reversals.
The color-coded system helps traders quickly interpret market conditions, with different colors representing change durations, trend strengths, and price movement characteristics. This approach allows for more nuanced and intuitive market analysis compared to standard charting methods.
When to explore it
The indicator is most effective in markets with significant volume fluctuations and during periods of potential trend transitions. It is particularly useful for traders seeking to understand the underlying volume dynamics that drive price movements and identify potential trend reversals.
Traders should apply this indicator in liquid markets with consistent trading volumes, such as major currency pairs, popular stocks, and high-volume commodities. It is especially valuable during volatile market conditions where volume changes can provide critical insights into market sentiment and potential directional shifts.
Keep exploring
What we’ve verified
Access, alerts and repainting behaviour have not been independently verified for this indicator. Check the creator’s current publication and settings.
General descriptions and classifications are recovered research. Verified details above identify the specific checks we have completed. Check the creator’s current publication for later changes.