A multi-timeframe indicator using weighted moving averages and highest volume candle analysis to identify dynamic trend and support/resistance levels for precise trading decisions.
Explore complementary indicator rolesHow it works
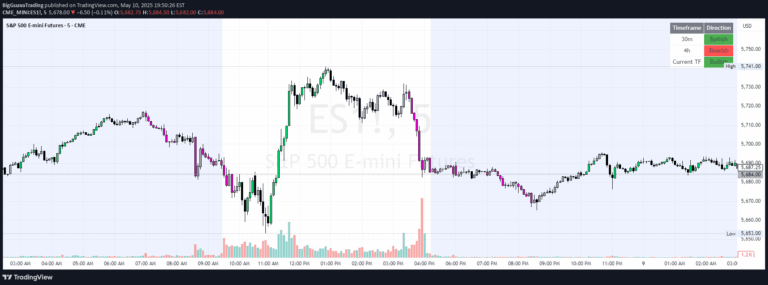
The indicator calculates three weighted moving averages (WMA) across 5, 15, and 30-minute timeframes, applying different weights to recent prices for more responsive trend detection. Each WMA is color-coded (yellow, blue, red) to help traders quickly visualize trend dynamics and potential crossover signals.
Simultaneously, the indicator identifies the highest volume candle within the selected intraday timeframe, typically set at 3 minutes. It then plots horizontal green and red lines representing the high and low of this highest volume candle, creating dynamic support and resistance levels that update daily to reflect current market conditions.
Why it may be useful
By combining multiple timeframe analysis with volume-based support and resistance levels, traders gain a more comprehensive view of market dynamics. The weighted moving averages provide smoother trend identification compared to traditional moving averages, reducing noise and helping traders distinguish between genuine trend changes and temporary price fluctuations.
The volume-based level identification adds an extra layer of market insight, allowing traders to recognize key price zones where significant trading activity has occurred. This approach helps traders make more informed decisions by aligning trend analysis with actual trading volume and market participation.
When to explore it
This indicator is most effective in liquid, actively traded markets with consistent intraday volume, such as major forex pairs, stock indices, and popular cryptocurrency pairs. It works best during periods of moderate to high market volatility, where clear trend identification and dynamic support/resistance levels can provide meaningful trading signals.
Traders should be particularly attentive to instances where the colored WMA lines cross or align, and where the volume-based support/resistance levels coincide with other technical analysis signals. The indicator is especially valuable for short-term traders seeking to capitalize on intraday price movements with a structured, data-driven approach.
Keep exploring
What we’ve verified
Access, alerts and repainting behaviour have not been independently verified for this indicator. Check the creator’s current publication and settings.
General descriptions and classifications are recovered research. Verified details above identify the specific checks we have completed. Check the creator’s current publication for later changes.