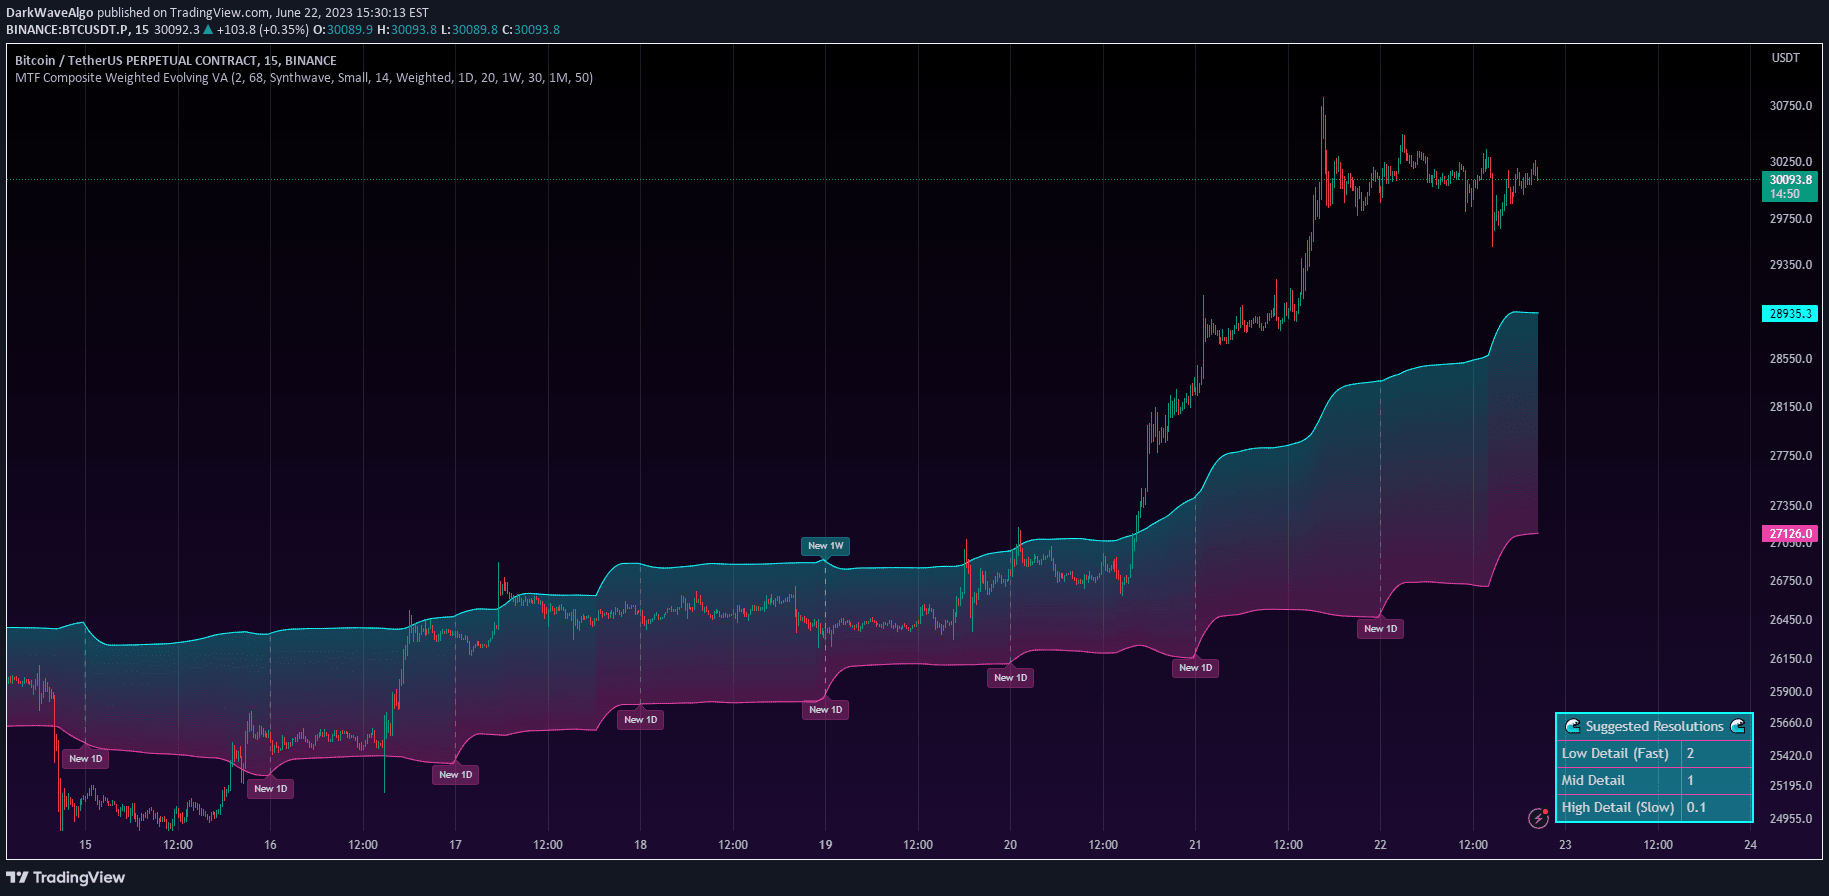
A multi-timeframe evolving value area indicator that calculates trading activity zones across different periods, providing dynamic insights into market value ranges.
Explore complementary indicator rolesHow it works
The indicator calculates value areas across three customizable timeframes by analyzing price distribution and trading volume. It identifies a specified percentage (typically 70-80%) of trading activity and defines the price range where most trading occurred during each period.
These individual timeframe value areas are then combined into a composite, weighted calculation that provides a more nuanced view of market activity. The composite value area uses weighting percentages to determine each timeframe's contribution, creating a rolling, evolving representation of market value zones.
Why it may be useful
Traditional value area indicators are static and reset at each period, limiting their real-time usefulness for traders seeking dynamic market insights. This multi-timeframe approach offers a more comprehensive view of where traders find value across different time horizons.
By combining multiple timeframes with weighted calculations, traders can better understand market dynamics, potential support and resistance levels, and the progression of trading activity. The indicator helps traders identify key price ranges and market sentiment more effectively than traditional single-period value area methods.
When to explore it
This indicator is most effective in markets with consistent trading volume and clear price discovery mechanisms, such as futures, forex, and heavily traded stocks. It works best when traders want a comprehensive view of market value across multiple timeframes, helping to identify potential entry and exit points.
Traders can leverage this tool during trending and ranging markets to understand where the majority of trading activity occurs. It is particularly useful for identifying potential support and resistance levels, understanding market sentiment, and making more informed trading decisions across different trading styles and timeframes.
Keep exploring
What we’ve verified
Access, alerts and repainting behaviour have not been independently verified for this indicator. Check the creator’s current publication and settings.
General descriptions and classifications are recovered research. Verified details above identify the specific checks we have completed. Check the creator’s current publication for later changes.