
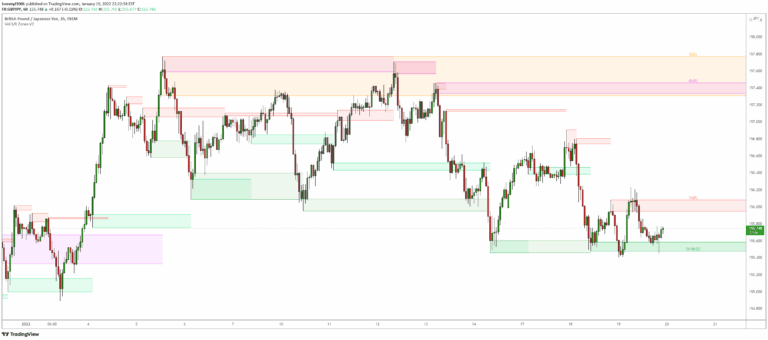
Volume-based Support & Resistance Zones
An advanced Support & Resistance indicator that identifies significant price zones using volume and fractal highs/lows, helping traders visualize potential trend reversals and continuations.
Explore 11,183 indicators. Filter beyond the obvious.
Discover the tools that fit the way you trade.
11,183 tools to explore
An advanced Support & Resistance indicator that identifies significant price zones using volume and fractal highs/lows, helping traders visualize potential trend reversals and continuations.
CM MACD Ultimate Multi-Timeframe V2 is an advanced MACD indicator with enhanced customization options, multi-timeframe analysis, and comprehensive trend visualization features.
A multi-timeframe support and resistance indicator that identifies key price levels, breakouts, tests, retests, and rejections to help traders understand market dynamics.
A multi-timeframe support and resistance indicator that helps traders identify key price levels by analyzing market data across different time frames and customizable settings.
FATS is an advanced trading indicator that automatically draws trend lines, Fibonacci levels, and trend sights across multiple timeframes to help traders identify market direction and potential support/resistance zones.
A multi-timeframe support and resistance indicator that identifies key price zones, tracks breaks and retests, and provides comprehensive market trend analysis for traders.
A multi-timeframe supply and demand indicator that identifies trading zones based on momentum candles, helping traders recognize potential support and resistance levels.
Zero Lag Trend Signals is an advanced indicator that eliminates trend detection delays by using zero-lag EMA and volatility bands across multiple timeframes.
A multi-timeframe Fair Value Gap indicator that identifies market imbalances and potential price targets by highlighting gaps between price candles across different timeframes.
A market structure oscillator that analyzes short, intermediate, and long-term market trends to help traders identify potential trend shifts and momentum changes.
A multi-timeframe candle visualization script that provides advanced trading insights, including volume information, remaining candle time, and breakout detection with customizable display options.
A multi-timeframe stochastic oscillator system using 28 different stochastic lengths to analyze market momentum and generate trading signals through color-coded visualization.
Likes, views, and comments are historical TradingView snapshots. They describe attention, not trading performance.




