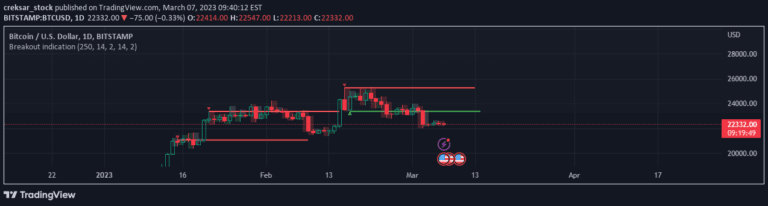
A multi-timeframe candle visualization script that provides advanced trading insights, including volume information, remaining candle time, and breakout detection with customizable display options.
Explore complementary indicator rolesHow it works
The script analyzes multiple timeframe candles simultaneously, creating a comprehensive visual representation of price action. It generates custom candle displays with optional 3D effects, tracking volume information and current candle status.
Users can customize colors, timeframes, and display settings to match their specific trading preferences. The script uses Pine Script's advanced features to create dynamic line arrays and visual representations. It automatically tracks and highlights new highs, lows, and potential breakouts across different timeframes
Why it may be useful
This script provides traders with a more holistic view of market movements by integrating multiple timeframe analyses. It helps traders understand price action context beyond traditional single-timeframe charts.
The visual customization options allow traders to adapt the script to their unique trading style and preferences. By showing remaining candle time and volume information, traders can make more informed decisions. The breakout detection feature helps identify potential trend changes and entry/exit points more effectively
When to explore it
The script works best for traders who want a comprehensive market overview across multiple timeframes. It is particularly useful for swing and day traders who need to monitor price action and volume simultaneously. Traders can leverage this script during trending markets or when analyzing potential breakout scenarios.
The customizable nature makes it suitable for various market conditions, including stocks, forex, and cryptocurrency trading. It is especially helpful for traders who prefer visual and detailed market representations
Keep exploring
What we’ve verified
Access, alerts and repainting behaviour have not been independently verified for this indicator. Check the creator’s current publication and settings.
General descriptions and classifications are recovered research. Verified details above identify the specific checks we have completed. Check the creator’s current publication for later changes.