
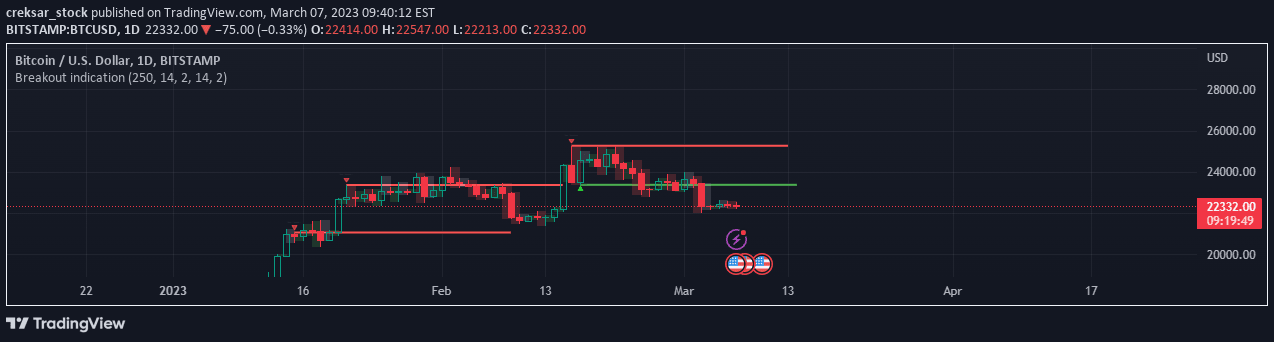
A volatility-based breakout indicator that identifies potential trading opportunities by tracking price movements and candle color changes, helping traders spot market entry and exit points.
Explore complementary indicator rolesHow it works
The Breakout Identifier works by analyzing price movements and comparing current candle characteristics to previous candles, generating signals based on volatility and price action. It uses color-coded indicators to highlight potential market shifts, with green signaling higher highs, red signaling lower lows, and silver indicating neutral conditions.
Traders can customize the signal parameters by adjusting the gap between signals and price thresholds. The indicator plots pivot points alongside signals, which helps traders understand potential trading ranges and identify potential market traps or trend reversals.
Why it may be useful
The Breakout Identifier provides traders with a dynamic tool for understanding market volatility and potential price movements across different timeframes. By offering visual cues through color-coded candles, traders can quickly assess market momentum and potential trend changes without complex calculations.
This indicator is particularly valuable because it simplifies complex market analysis, allowing traders to make more informed decisions based on clear, visual representations of price action and market volatility.
When to explore it
The Breakout Identifier is most effective in markets with clear trending or volatile conditions, where price movements are significant and directional. It works best during periods of active trading, such as during market open or when major economic news is expected to impact prices.
Traders should use this indicator in conjunction with other technical analysis tools to confirm signals and reduce false positives. It is particularly useful for short-term trading strategies that rely on quick identification of potential market shifts and breakout opportunities.
Keep exploring
What we’ve verified
Access, alerts and repainting behaviour have not been independently verified for this indicator. Check the creator’s current publication and settings.
General descriptions and classifications are recovered research. Verified details above identify the specific checks we have completed. Check the creator’s current publication for later changes.


