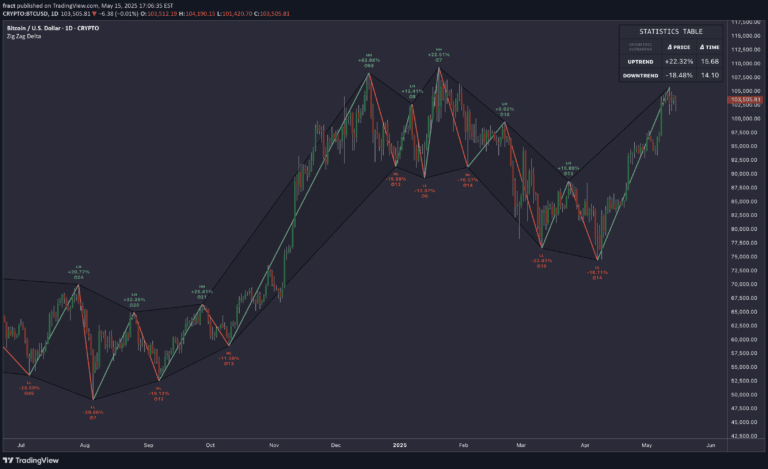
A trading tool that identifies typical sweep distances above pivot highs and lows in different markets, helping traders understand potential stop raid patterns and market consolidation zones.
Explore complementary indicator rolesHow it works
The tool calculates and displays consistent sweep distances above and below pivot highs and lows in different financial markets. It allows traders to customize the sweep distance in pips or handles depending on the specific asset class, with options for forex, indices, commodities, and cryptocurrencies.
By analyzing historical price action, the indicator identifies typical stop raid zones and visualizes them through configurable boxes. Users can adjust pivot lookback periods, choose sweep distances, and control box display settings to match their specific trading requirements and market analysis.
Why it may be useful
Understanding typical market sweep distances provides traders with critical insights into potential stop loss hunting and market manipulation strategies. This tool helps identify common price action patterns that institutional traders might use to trigger liquidity and create market movement.
By revealing consistent sweep ranges, traders can better anticipate potential market reversals, improve risk management, and develop more strategic entry and exit points. The flexible configuration allows for precise analysis across different asset classes and trading styles.
When to explore it
This signal works best during consolidation and ranging market conditions where predictable sweep patterns are more likely to emerge. It is particularly useful for traders focusing on short-term price movements and looking to understand institutional trading behavior.
The tool is most effective when applied to liquid markets with consistent trading volumes, such as major forex pairs, stock indices, commodities, and cryptocurrencies. Traders should combine this signal with other technical and fundamental analysis to confirm potential trading opportunities.
Keep exploring
What we’ve verified
Access, alerts and repainting behaviour have not been independently verified for this indicator. Check the creator’s current publication and settings.
General descriptions and classifications are recovered research. Verified details above identify the specific checks we have completed. Check the creator’s current publication for later changes.