LNL Trend System
LNL Trend System is an ATR-based day trading system using trend and stop lines to identify market trends and potential trading opportunities across multiple timeframes.
Explore 11,183 indicators. Filter beyond the obvious.
Discover the tools that fit the way you trade.
11,183 tools to explore
LNL Trend System is an ATR-based day trading system using trend and stop lines to identify market trends and potential trading opportunities across multiple timeframes.
An advanced support and resistance indicator that dynamically identifies key price levels using multi-timeframe analysis and volume confirmation, with automatic role reversal capabilities.
An advanced trading tool that automatically plots opening range and previous day's high/low levels to help traders identify potential market sentiment and trading opportunities.
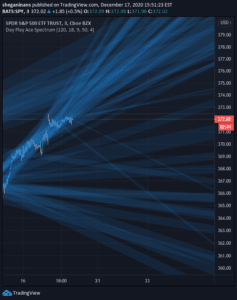
Daily Play Ace Spectrum is an advanced, configurable trading indicator extending the original Ace Spectrum with more parameters for enhanced sensitivity and adaptability across shorter timeframes.
A scalping indicator using multiple candlestick patterns to identify high-probability trading opportunities across different timeframes with minimal indicator reliance.
An advanced SuperTrend indicator that uses market entropy to dynamically adjust trend sensitivity, providing more adaptive and intelligent trend tracking across different market conditions.
AI-powered support and resistance indicator that automatically detects and highlights critical price levels using advanced algorithms, providing traders with intelligent, real-time market insights.
An advanced market structure indicator that identifies potential trend reversals by detecting Break of Structure (BoS) and Change of Character (CHoCH) signals with visual and alert features.
ATR Levels indicator generates horizontal lines above and below a center line, using average true range to measure price volatility and create a dynamic grid for trading reference.
A day trading indicator that tracks and displays key price levels throughout the trading session, helping traders identify potential support and resistance zones.
The Optimal Buy Day indicator analyzes historical price data to identify the most advantageous days for monthly investments, comparing systematic and randomized buying strategies.
Day/Week/Month Metrics indicator analyzes historical trading performance across different time scales, providing statistical insights into market behavior and potential trading opportunities.
Likes, views, and comments are historical TradingView snapshots. They describe attention, not trading performance.