Machine Learning RSI ║ BullVision
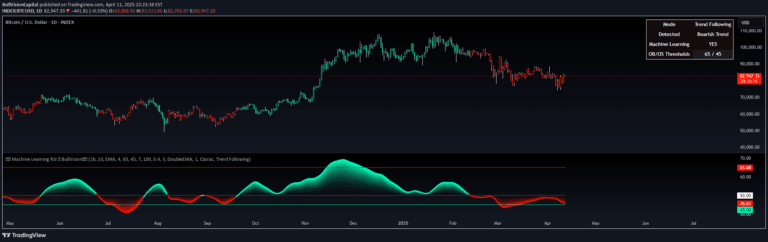
A sophisticated RSI indicator that uses machine learning and K-Nearest Neighbors to dynamically adapt momentum analysis by comparing current market conditions with historical patterns.
Explore 11,183 indicators. Filter beyond the obvious.
Discover the tools that fit the way you trade.
11,183 tools to explore
A sophisticated RSI indicator that uses machine learning and K-Nearest Neighbors to dynamically adapt momentum analysis by comparing current market conditions with historical patterns.
The Adaptive DEMA Momentum Oscillator dynamically measures market momentum by combining Double Exponential Moving Average with normalized standard deviation, providing adaptive insights into trend strength and market conditions.
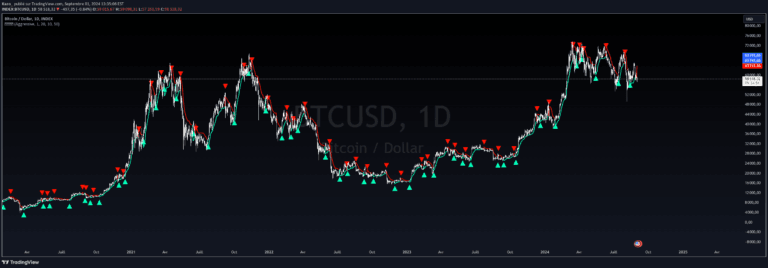
An advanced SuperTrend indicator that uses market entropy to dynamically adjust trend sensitivity, providing more adaptive and intelligent trend tracking across different market conditions.
The Boosted Moving Average (BMA) enhances traditional EMA by introducing a boost factor that amplifies price change responsiveness and provides clearer market trend visualization.
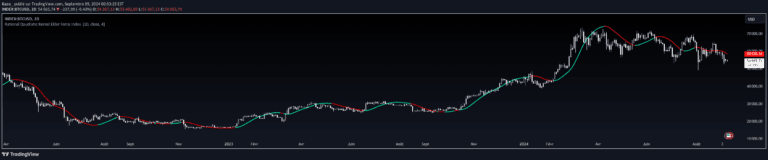
An advanced Elder Force Index using rational quadratic kernel smoothing to measure price movement strength by combining price change and volume with enhanced analytical precision.
Advanced Heikin Ashi indicator with smooth step oscillator that enhances trend analysis through sophisticated smoothing techniques and customizable momentum visualization.
The Boltzmann Weighted Moving Average (BWMA) is an innovative technical indicator that uses statistical mechanics to dynamically weight price data, providing adaptive trend analysis with color-coded trend signals.
The Liquidity Weighted Supertrend Indicator enhances trend detection by incorporating trading volume and adaptive moving averages to provide more responsive market trend signals.
A sophisticated stochastic oscillator using Fourier Transform techniques to smooth traditional momentum signals, reducing noise and providing more reliable trading insights.
An adaptive technical analysis tool that dynamically adjusts its length based on market volatility, showing price deviations from a least squares moving average through a color-coded histogram.
The Volume-Weighted Trend Strength Index (VWTSI) combines trend strength, volume, and volatility to provide a comprehensive market analysis tool that can be visualized as an oscillator or moving average.
A dynamic Rate of Change oscillator that calculates multi-length momentum using weighted calculations and displays results via a color-coded histogram for enhanced market trend analysis.
Likes, views, and comments are historical TradingView snapshots. They describe attention, not trading performance.