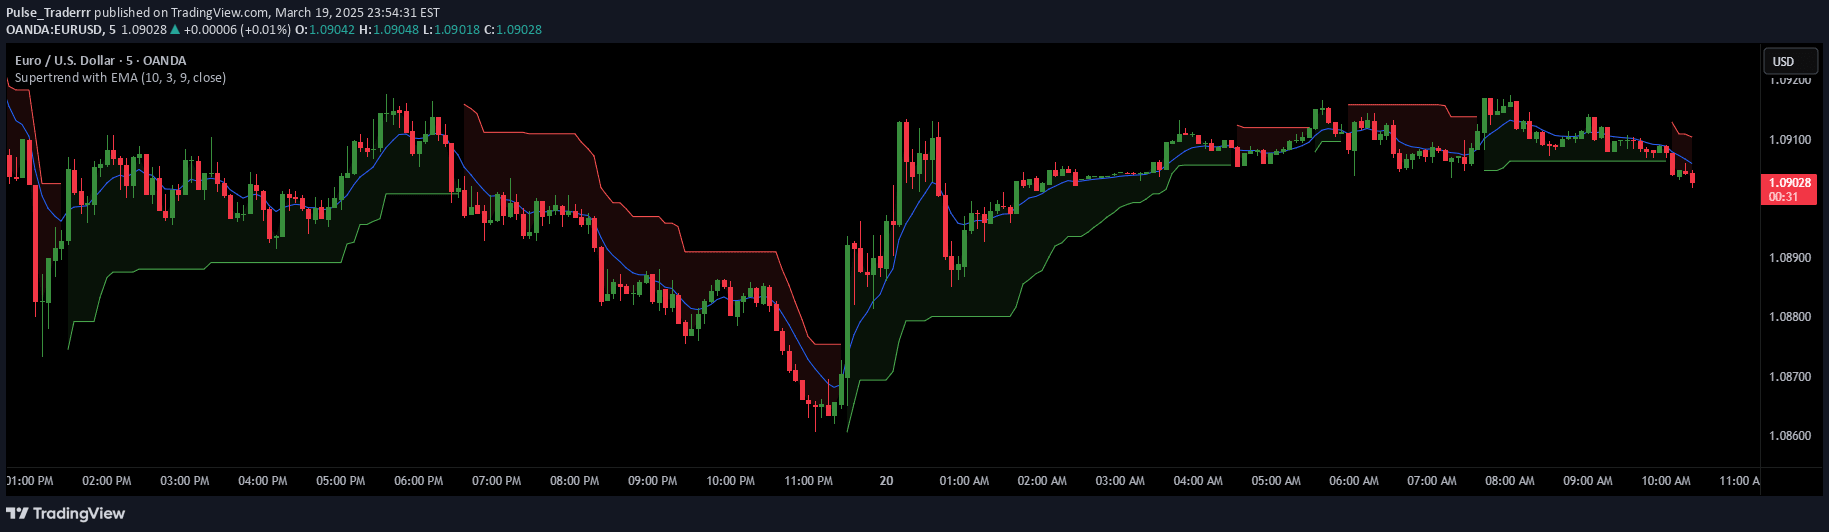
The Liquidity Weighted Supertrend Indicator enhances trend detection by incorporating trading volume and adaptive moving averages to provide more responsive market trend signals.
Explore complementary indicator rolesHow it works
The Liquidity Weighted Supertrend Indicator calculates trend direction by combining volume-weighted price movements with moving average smoothing. It uses a unique Liquidity Weighted Moving Average (LWMA) that multiplies trading volume with price changes, then smooths this data using an Exponential Moving Average (EMA).
The indicator offers two operational modes: Aggressive and Smoothed. In Aggressive mode, it uses EMA for faster signal generation, while Smoothed mode employs SMA for more stable trend identification. The Supertrend line changes color between lime and red to indicate bullish or bearish trends, with additional directional arrows providing clear entry and exit signals.
Why it may be useful
Traditional trend indicators often fail to capture the nuanced dynamics of market movements, but the Liquidity Weighted Supertrend provides a more sophisticated approach by integrating volume data into trend analysis. By weighting price movements according to trading volume, it offers traders a more accurate representation of market sentiment and potential trend reversals.
The indicator's ability to adapt to different market conditions through its Aggressive and Smoothed modes makes it a versatile tool for traders across various timeframes and trading styles. Its visual signals and customizable parameters allow traders to fine-tune their analysis and make more informed trading decisions based on comprehensive market insights.
When to explore it
The Liquidity Weighted Supertrend Indicator is most effective in markets with clear directional movements and significant trading volume. It performs exceptionally well in trending markets where price movements are accompanied by substantial liquidity, making it ideal for stocks, forex, and cryptocurrency trading.
Traders should utilize this indicator when seeking to confirm trend strength, identify potential entry and exit points, and minimize false signals. It is particularly useful during periods of market volatility, where traditional trend indicators might provide less reliable information. By adjusting its parameters, traders can optimize the indicator's performance across different market conditions and trading timeframes.
Keep exploring
What we’ve verified
Access, alerts and repainting behaviour have not been independently verified for this indicator. Check the creator’s current publication and settings.
General descriptions and classifications are recovered research. Verified details above identify the specific checks we have completed. Check the creator’s current publication for later changes.