
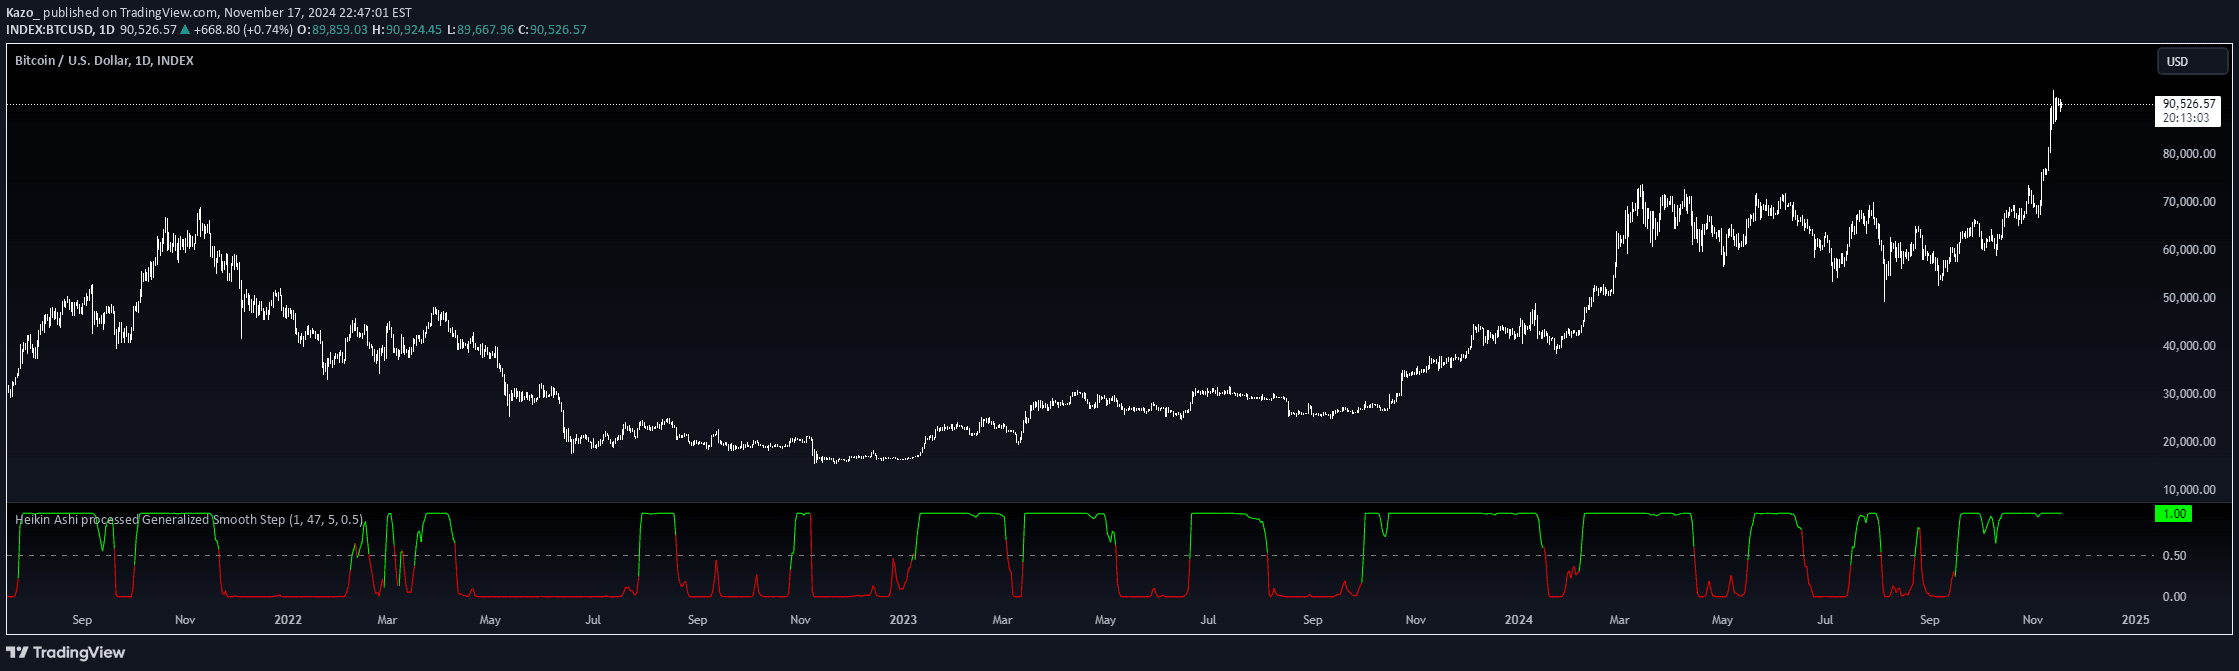
Advanced Heikin Ashi indicator with smooth step oscillator that enhances trend analysis through sophisticated smoothing techniques and customizable momentum visualization.
Explore complementary indicator rolesHow it works
The Smooth Step Heikin Ashi Indicator calculates modified candlestick values using advanced smoothing algorithms, integrating Pascal's triangle-based calculations to refine price momentum representation. It processes price data through multiple computational layers, transforming standard price information into a more nuanced trend visualization.
The indicator applies customizable smoothing factors to Open, High, Low, and Close values, creating a refined view of market dynamics. By implementing a second-level Heikin Ashi calculation and adjustable oscillator parameters, the tool provides traders with a flexible mechanism for interpreting market movements and identifying potential trend shifts.
Why it may be useful
This indicator offers traders a sophisticated approach to trend analysis by reducing market noise and providing clearer trend signals through advanced computational techniques. By smoothing price data and creating a more precise momentum representation, it helps traders make more informed decisions about market direction and potential entry or exit points.
The tool's flexibility in customization allows traders to adapt the indicator to different market conditions and trading styles, making it a versatile analytical instrument. Its ability to filter out short-term market fluctuations while maintaining sensitivity to meaningful price movements provides traders with a refined perspective on market dynamics.
When to explore it
The Smooth Step Heikin Ashi Indicator is most effective in markets with moderate to strong trending characteristics, where traditional price analysis might be obscured by short-term volatility. It performs exceptionally well in financial instruments that demonstrate clear directional movement, such as major currency pairs, stock indices, and prominent commodities.
Traders should utilize this indicator when seeking to confirm trend strength, identify potential trend reversals, and filter out market noise. It is particularly useful during periods of market transition, helping traders distinguish between temporary price fluctuations and genuine trend changes across various timeframes.
Keep exploring
What we’ve verified
Access, alerts and repainting behaviour have not been independently verified for this indicator. Check the creator’s current publication and settings.
General descriptions and classifications are recovered research. Verified details above identify the specific checks we have completed. Check the creator’s current publication for later changes.


