
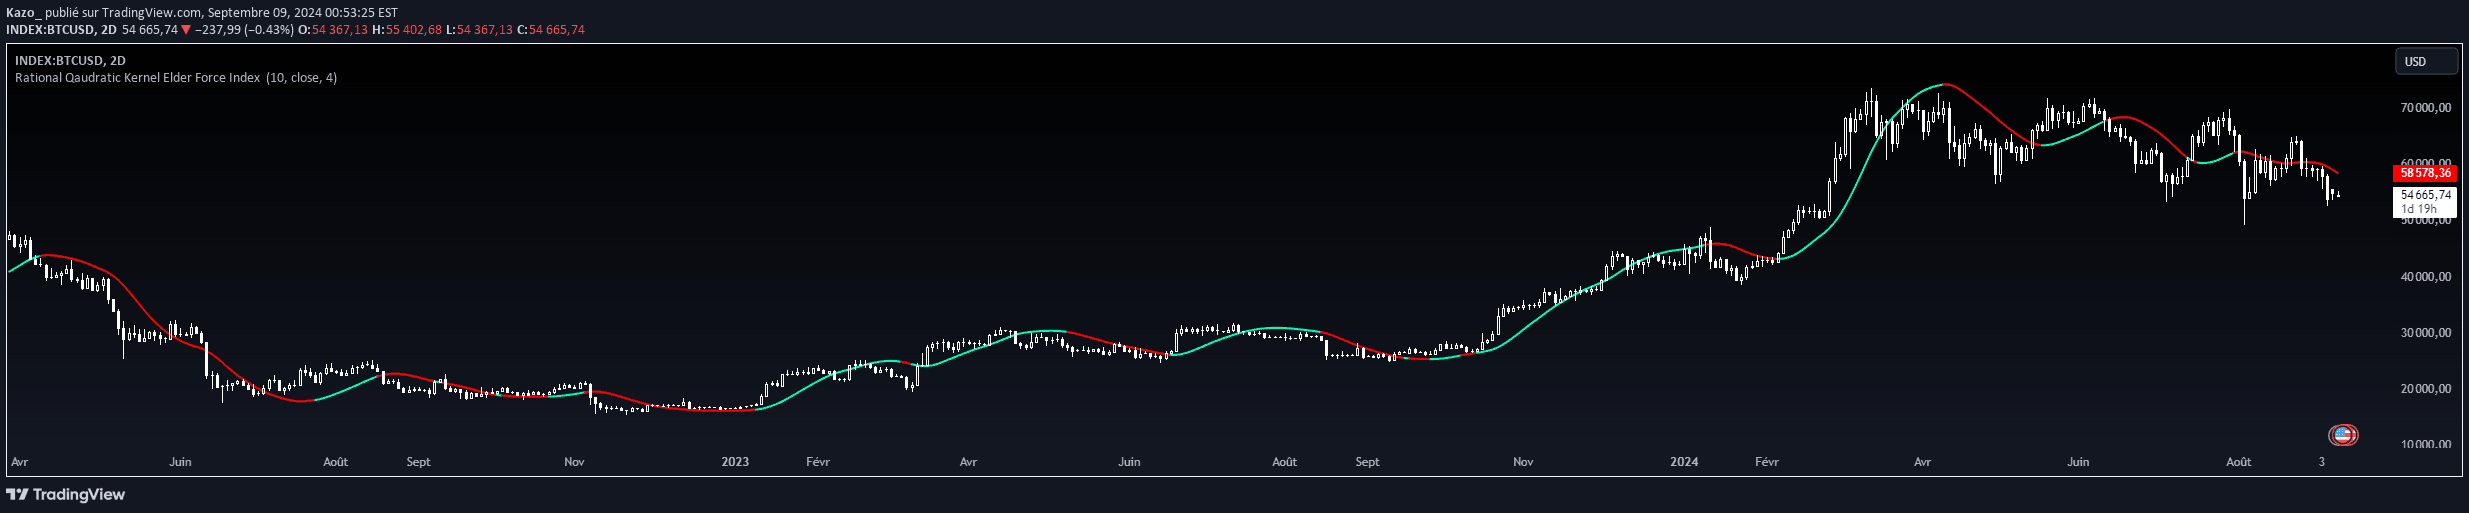
An advanced Elder Force Index using rational quadratic kernel smoothing to measure price movement strength by combining price change and volume with enhanced analytical precision.
Explore complementary indicator rolesHow it works
The Elder Force Index calculates market momentum by multiplying price change between bars with current bar volume. It provides a raw measure of price movement strength and trading pressure.
A rational quadratic kernel regression is then applied to smooth the raw Elder Force Index data, reducing market noise and creating a more stable signal. By adjusting parameters like smoothing window length and relative weighting, traders can customize the indicator's sensitivity to match their specific trading strategy and market conditions.
Why it may be useful
The Rational Quadratic Kernel Elder Force Index offers traders a sophisticated tool for understanding market dynamics beyond simple price movement. By integrating volume and advanced smoothing techniques, it provides deeper insights into the underlying strength and potential momentum of price trends.
This indicator helps traders assess market sentiment more accurately by filtering out short-term market noise and presenting a clearer view of potential trend directions. Its adaptive nature allows for flexible interpretation across different market conditions and trading styles.
When to explore it
The Rational Quadratic Kernel Elder Force Index is most effective in markets with significant volume and clear directional movements. It performs exceptionally well in trending markets where price and volume are strongly correlated, helping traders identify potential entry and exit points.
Traders should use this indicator in conjunction with other technical analysis tools to confirm signals and validate potential trading opportunities. It is particularly useful during periods of market transition, helping to distinguish between genuine trend changes and temporary price fluctuations.
Keep exploring
What we’ve verified
Access, alerts and repainting behaviour have not been independently verified for this indicator. Check the creator’s current publication and settings.
General descriptions and classifications are recovered research. Verified details above identify the specific checks we have completed. Check the creator’s current publication for later changes.


