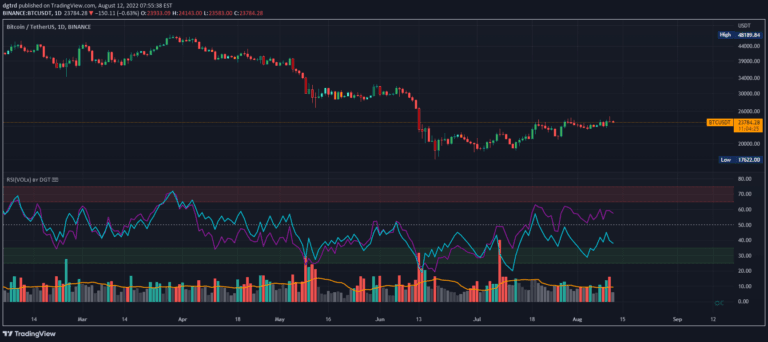
Relative Strength of Volume Indicators by DGT
RSI is a momentum oscillator measuring price movement speed, analyzing price changes and volume to identify potential trend reversals and market conditions.
Explore 11,183 indicators. Filter beyond the obvious.
Discover the tools that fit the way you trade.
11,183 tools to explore
RSI is a momentum oscillator measuring price movement speed, analyzing price changes and volume to identify potential trend reversals and market conditions.
An advanced indicator analyzing open interest flows and price sentiment using Elder-Ray concept to assess market activity, trader positioning, and potential trend dynamics.
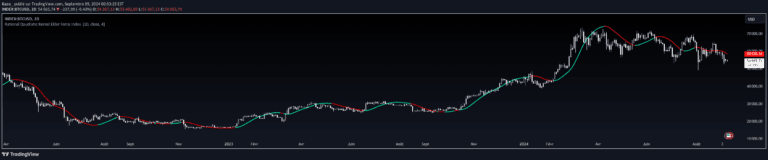
An advanced Elder Force Index using rational quadratic kernel smoothing to measure price movement strength by combining price change and volume with enhanced analytical precision.
A comprehensive trading signal combining multiple indicators like EMA, VWAP, SuperTrend, and Elder Impulse System to provide trend, momentum, and trading insights.
A hybrid indicator combining Double Exponential Moving Average with Elder Force Index to analyze price trends and volume strength, providing comprehensive market movement insights.
A sophisticated multi-filter trading signal that combines impulse breakouts, Elder's momentum, and ADX trend validation to generate precise directional entry points with high-quality confirmations.
A combined indicator analyzing market dynamics by overlaying Chaikin Money Flow and scaled Elder Force Index to assess buying/selling pressure and price momentum simultaneously.
A multi-length moving average indicator with color-coded gradient themes that helps traders quickly visualize trend direction, support/resistance levels, and potential market reversals.
A trading indicator that plots vertical lines and labels to mark the start and end of key global trading sessions, helping traders identify potential trading opportunities.
The Elder Force Index Oscillator combines volume and price movement to assess market trend strength and direction, providing traders with insights into market dynamics.
A technical analysis tool using moving averages and price volatility to identify overbought/oversold market conditions and potential price reversal points.
Likes, views, and comments are historical TradingView snapshots. They describe attention, not trading performance.