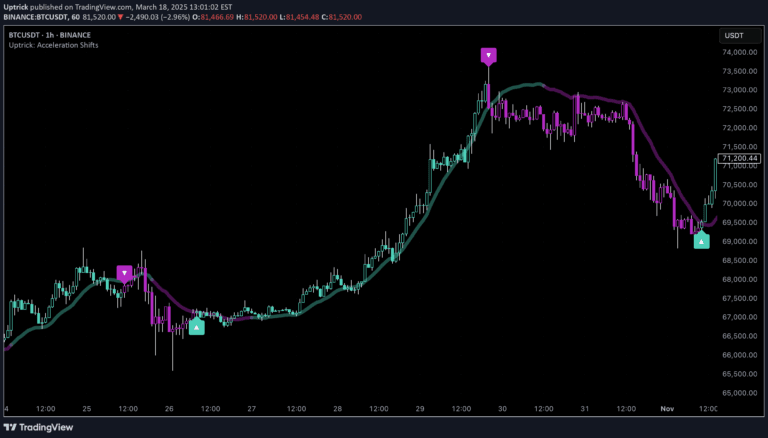
A multi-dimensional trading indicator that combines multiple moving averages and volume analysis to provide comprehensive insights into market trends and potential price movements.
Explore complementary indicator rolesHow it works
The indicator calculates multiple moving average types including Simple, Exponential, Weighted, Hull, and Kaufman's Adaptive to assess market trends from different perspectives. It plots these moving averages on the chart, allowing traders to visually compare current price action against different trend representations.
Simultaneously, the indicator integrates volume analysis by tracking trading volume and highlighting significant volume spikes. By combining moving average calculations with volume dynamics, traders can gain a more comprehensive understanding of market movements and potential trend strength.
Why it may be useful
The multi-moving average approach provides traders with a nuanced view of market trends by presenting trend analysis through multiple computational methods. This comprehensive perspective allows traders to cross-validate trend signals and reduce the likelihood of false interpretations based on a single moving average type.
By incorporating volume analysis alongside trend indicators, traders can confirm price movements with corresponding volume dynamics. This integrated approach enhances decision-making by providing contextual information about market liquidity and potential trend sustainability.
When to explore it
The indicator is most effective in markets with clear trending characteristics, where price movements demonstrate consistent directional momentum. It performs exceptionally well in liquid markets with substantial trading volume, enabling more reliable trend identification and potential entry/exit point recognition.
Traders should utilize this indicator across different timeframes, from short-term scalping to longer-term swing trading strategies. Its versatility makes it particularly useful during periods of market transition, helping traders identify potential trend reversals or continuations with greater confidence.
Keep exploring
What we’ve verified
Access, alerts and repainting behaviour have not been independently verified for this indicator. Check the creator’s current publication and settings.
General descriptions and classifications are recovered research. Verified details above identify the specific checks we have completed. Check the creator’s current publication for later changes.