
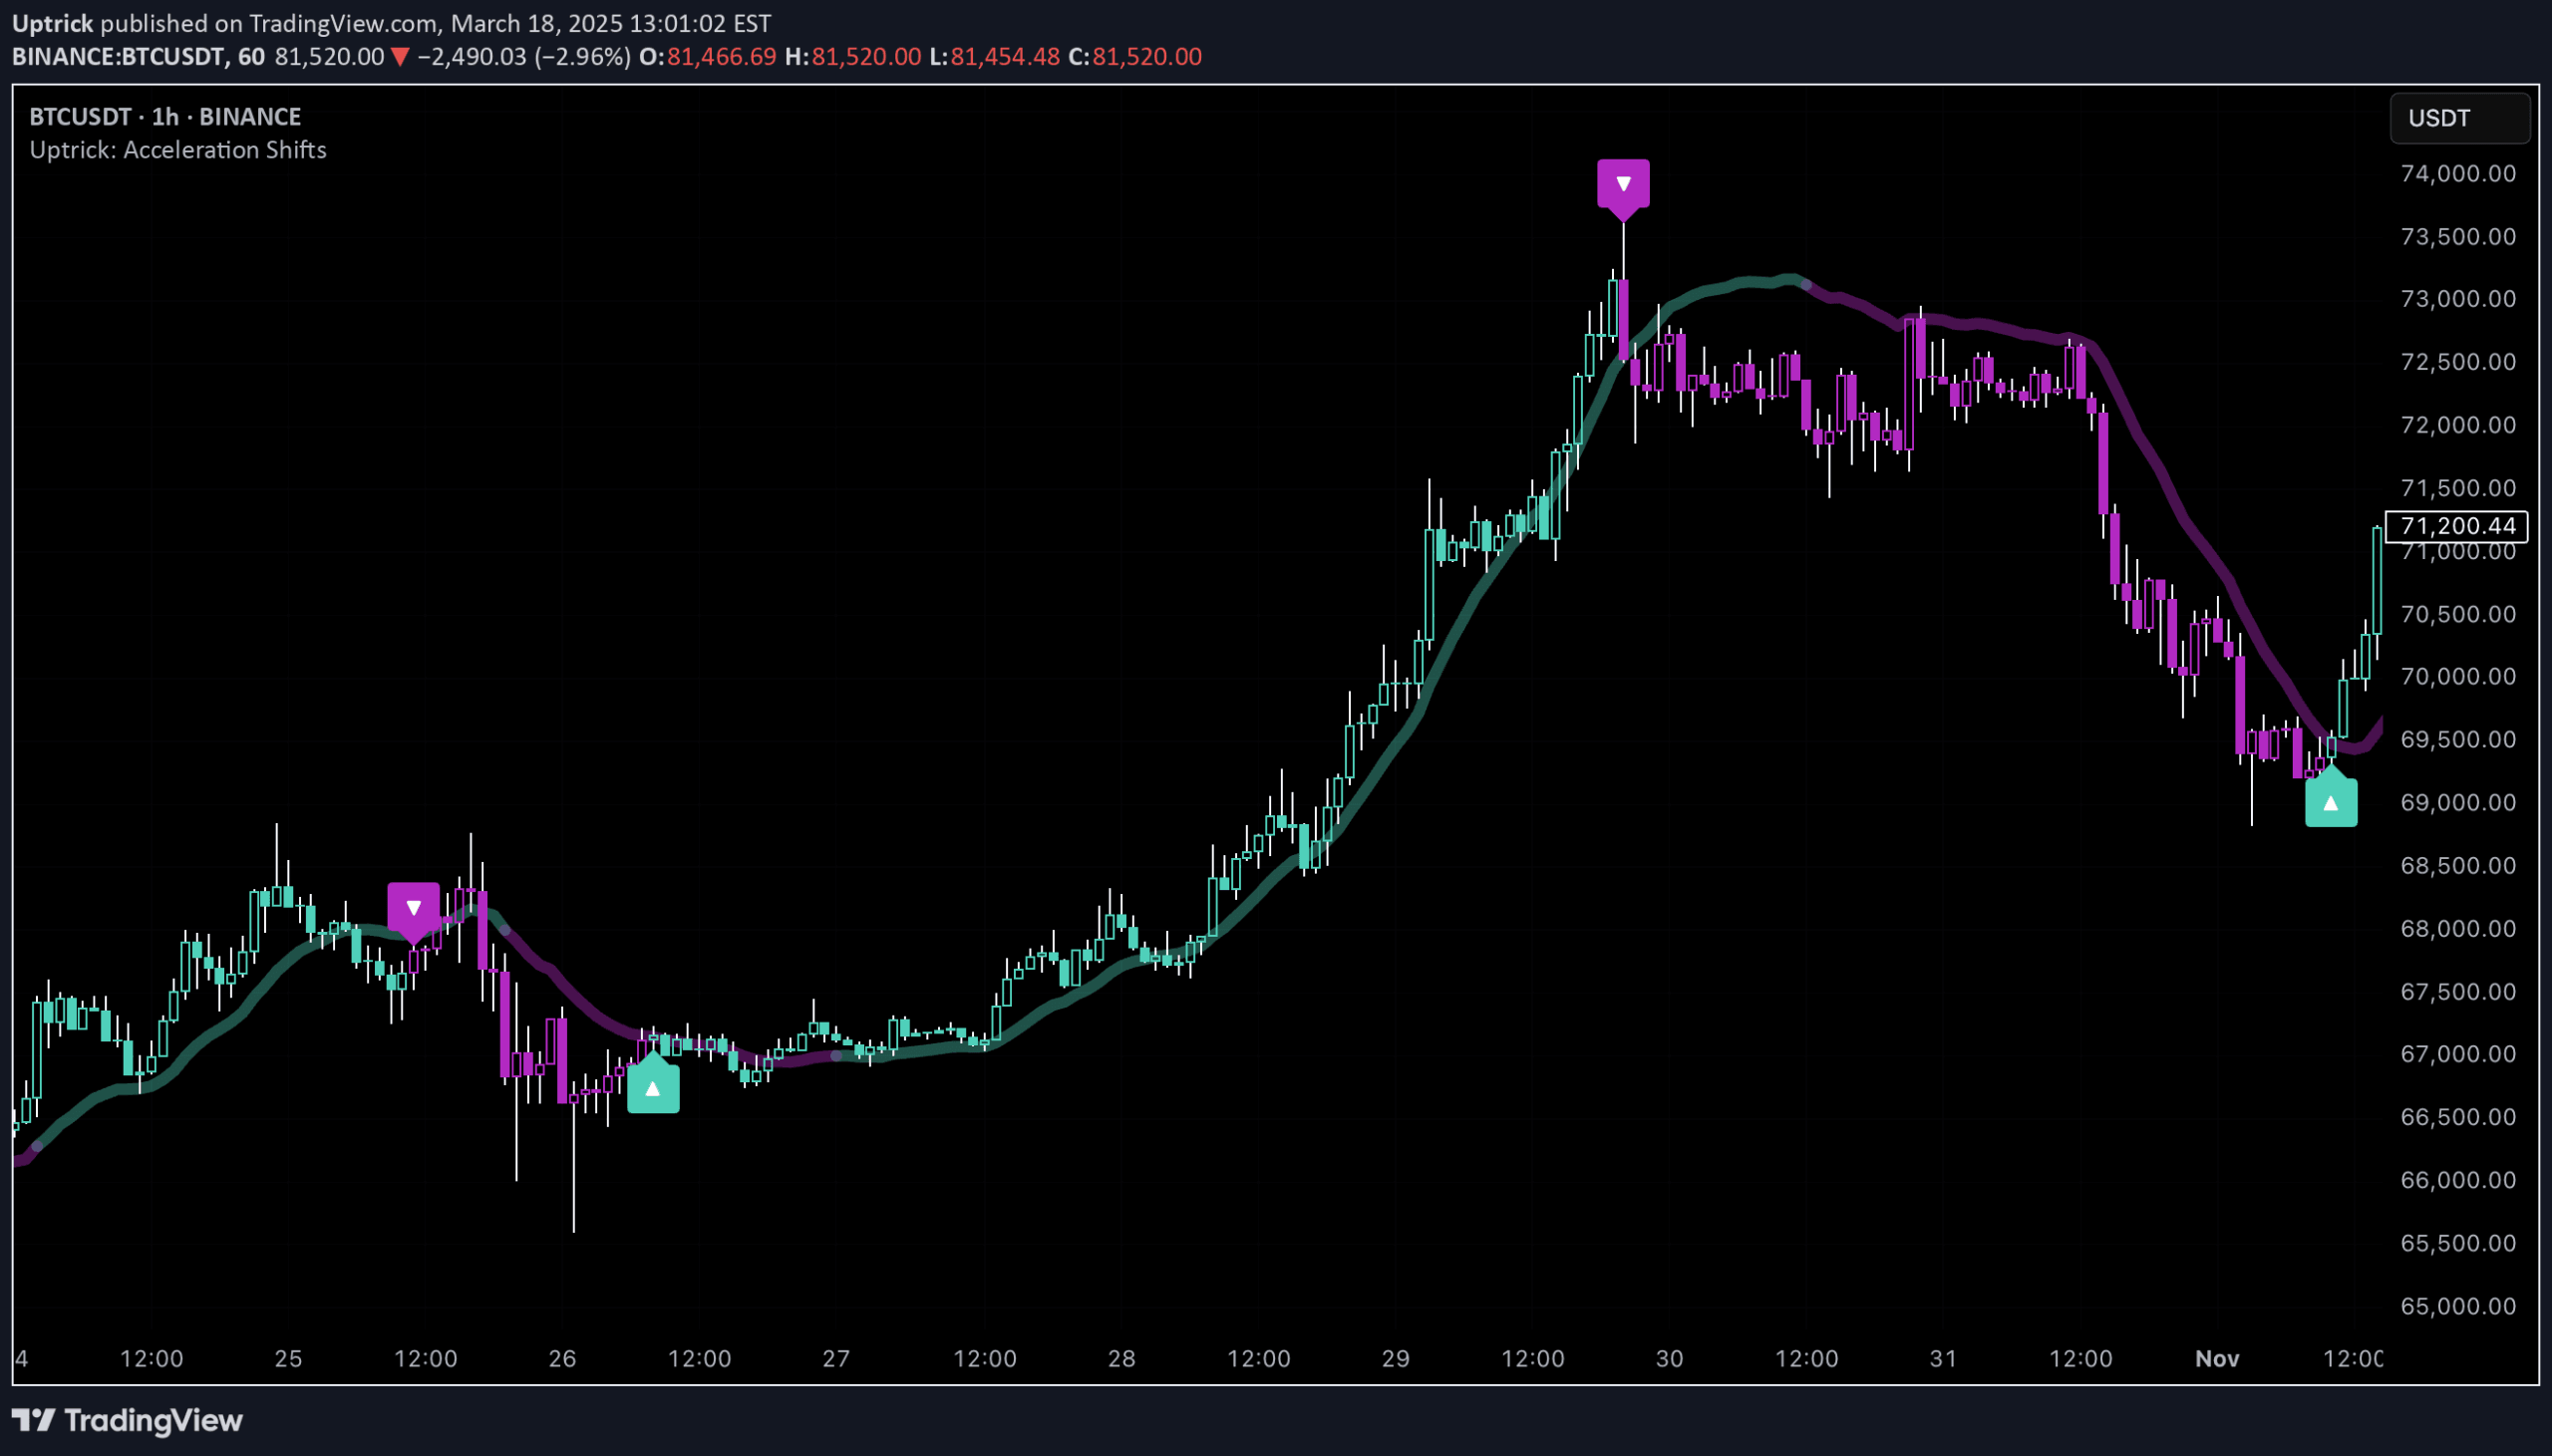
An advanced momentum indicator that measures price acceleration using multiple moving average techniques to detect strong trend shifts and potential trade entries with smart pyramiding capabilities.
Explore complementary indicator rolesHow it works
The Uptrick: Acceleration Shifts indicator calculates momentum by measuring velocity changes over time, computing acceleration as the rate of change in price velocity. It uses a selected moving average (such as TEMA, DEMA, or HMA) as a trend filter to validate signals, comparing current acceleration against a smoothed average acceleration.
When acceleration exceeds a predefined threshold, the indicator generates buy or sell signals, with additional confirmation from the chosen trend filter. The script can also implement smart pyramiding, allowing multiple entries within the same trend by using a lower secondary threshold for additional position entries, helping traders scale into strong market moves.
Why it may be useful
Traditional momentum indicators often lag behind market movements, but this acceleration-based approach provides a more dynamic and responsive method of identifying potential trend shifts. By measuring how quickly price velocity changes, traders can detect emerging momentum before conventional indicators, offering a potential competitive advantage in capturing early trend movements.
The indicator's flexibility in moving average selection, customizable thresholds, and optional pyramiding feature allows traders to adapt the tool to various market conditions and personal trading styles. Its built-in overbought/oversold checks further enhance signal reliability by reducing false entries during market extremes.
When to explore it
The Uptrick: Acceleration Shifts indicator works best in markets with clear momentum trends, such as during strong bullish or bearish market phases where price acceleration is pronounced. It is particularly effective in trending markets like stocks, cryptocurrencies, and forex, where price velocity can provide early signals of potential directional changes.
Traders should use this indicator in conjunction with other technical analysis tools and risk management strategies. It is most valuable when applied to timeframes from 5-minute charts for scalping to daily charts for swing trading, and performs optimally in markets with sufficient liquidity and consistent directional movement.
Keep exploring
What we’ve verified
Access, alerts and repainting behaviour have not been independently verified for this indicator. Check the creator’s current publication and settings.
General descriptions and classifications are recovered research. Verified details above identify the specific checks we have completed. Check the creator’s current publication for later changes.


