Uptrick: Z-Score Flow
A technical indicator that combines Z-Score, EMA trend, and RSI to identify statistically extreme price conditions while confirming trend direction and momentum for precise trade entries and exits.
Explore 11,183 indicators. Filter beyond the obvious.
Discover the tools that fit the way you trade.
11,183 tools to explore
A technical indicator that combines Z-Score, EMA trend, and RSI to identify statistically extreme price conditions while confirming trend direction and momentum for precise trade entries and exits.
Advanced trading indicator combining volume-weighted exponential moving averages with real-time volume analysis to identify market trends and trading opportunities across multiple financial markets.
Advanced trend analysis tool using Hull Moving Average with ATR thresholds and VWAP ribbons to identify market momentum, potential reversals, and trend direction with reduced lag.
A trading script that combines MACD and RSI to detect bullish and bearish signals, providing traders with automated entry and exit points based on momentum and trend strength.
A dynamic volatility indicator that combines Bollinger Bands and Average True Range to identify potential market reversals by analyzing price movement relative to adaptive volatility bands.
A dynamic trading signal using z-score bands and RSI momentum to identify mean-reversion opportunities with adaptive statistical filtering and robust entry confirmation.
A combined trading signal that merges RSI momentum with Bollinger Bands volatility to identify potential market extremes and highlight overbought or oversold conditions.
An advanced technical analysis indicator that adapts trend lines using multiple moving averages, tracks momentum, and provides comprehensive market insights across different trading timeframes.
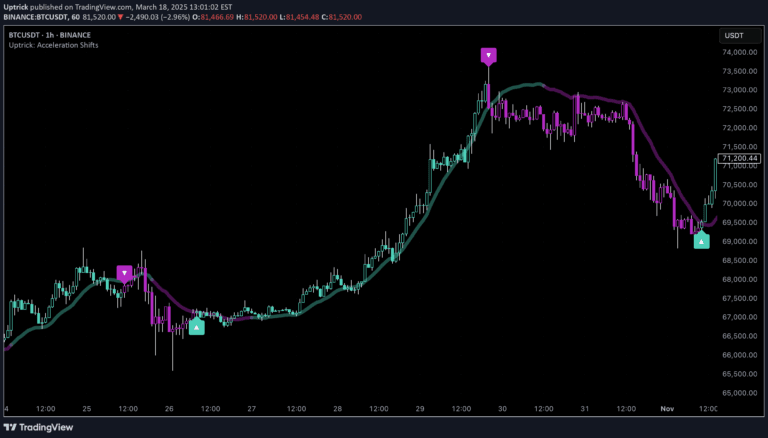
An advanced momentum indicator that measures price acceleration using multiple moving average techniques to detect strong trend shifts and potential trade entries with smart pyramiding capabilities.
A dynamic trend indicator that uses moving averages and streak analysis to identify market momentum, potential reversals, and provide visual trend insights across multiple price data points.
A dynamic trading indicator that uses dual Z-Score analysis on price and RSI to identify statistically significant mean reversion opportunities with adaptive visual enhancements.
A multi-layered trend indicator using smoothed moving averages that creates a density cloud to visualize market momentum and potential reversals through color-coded bars and triangles.
Likes, views, and comments are historical TradingView snapshots. They describe attention, not trading performance.