
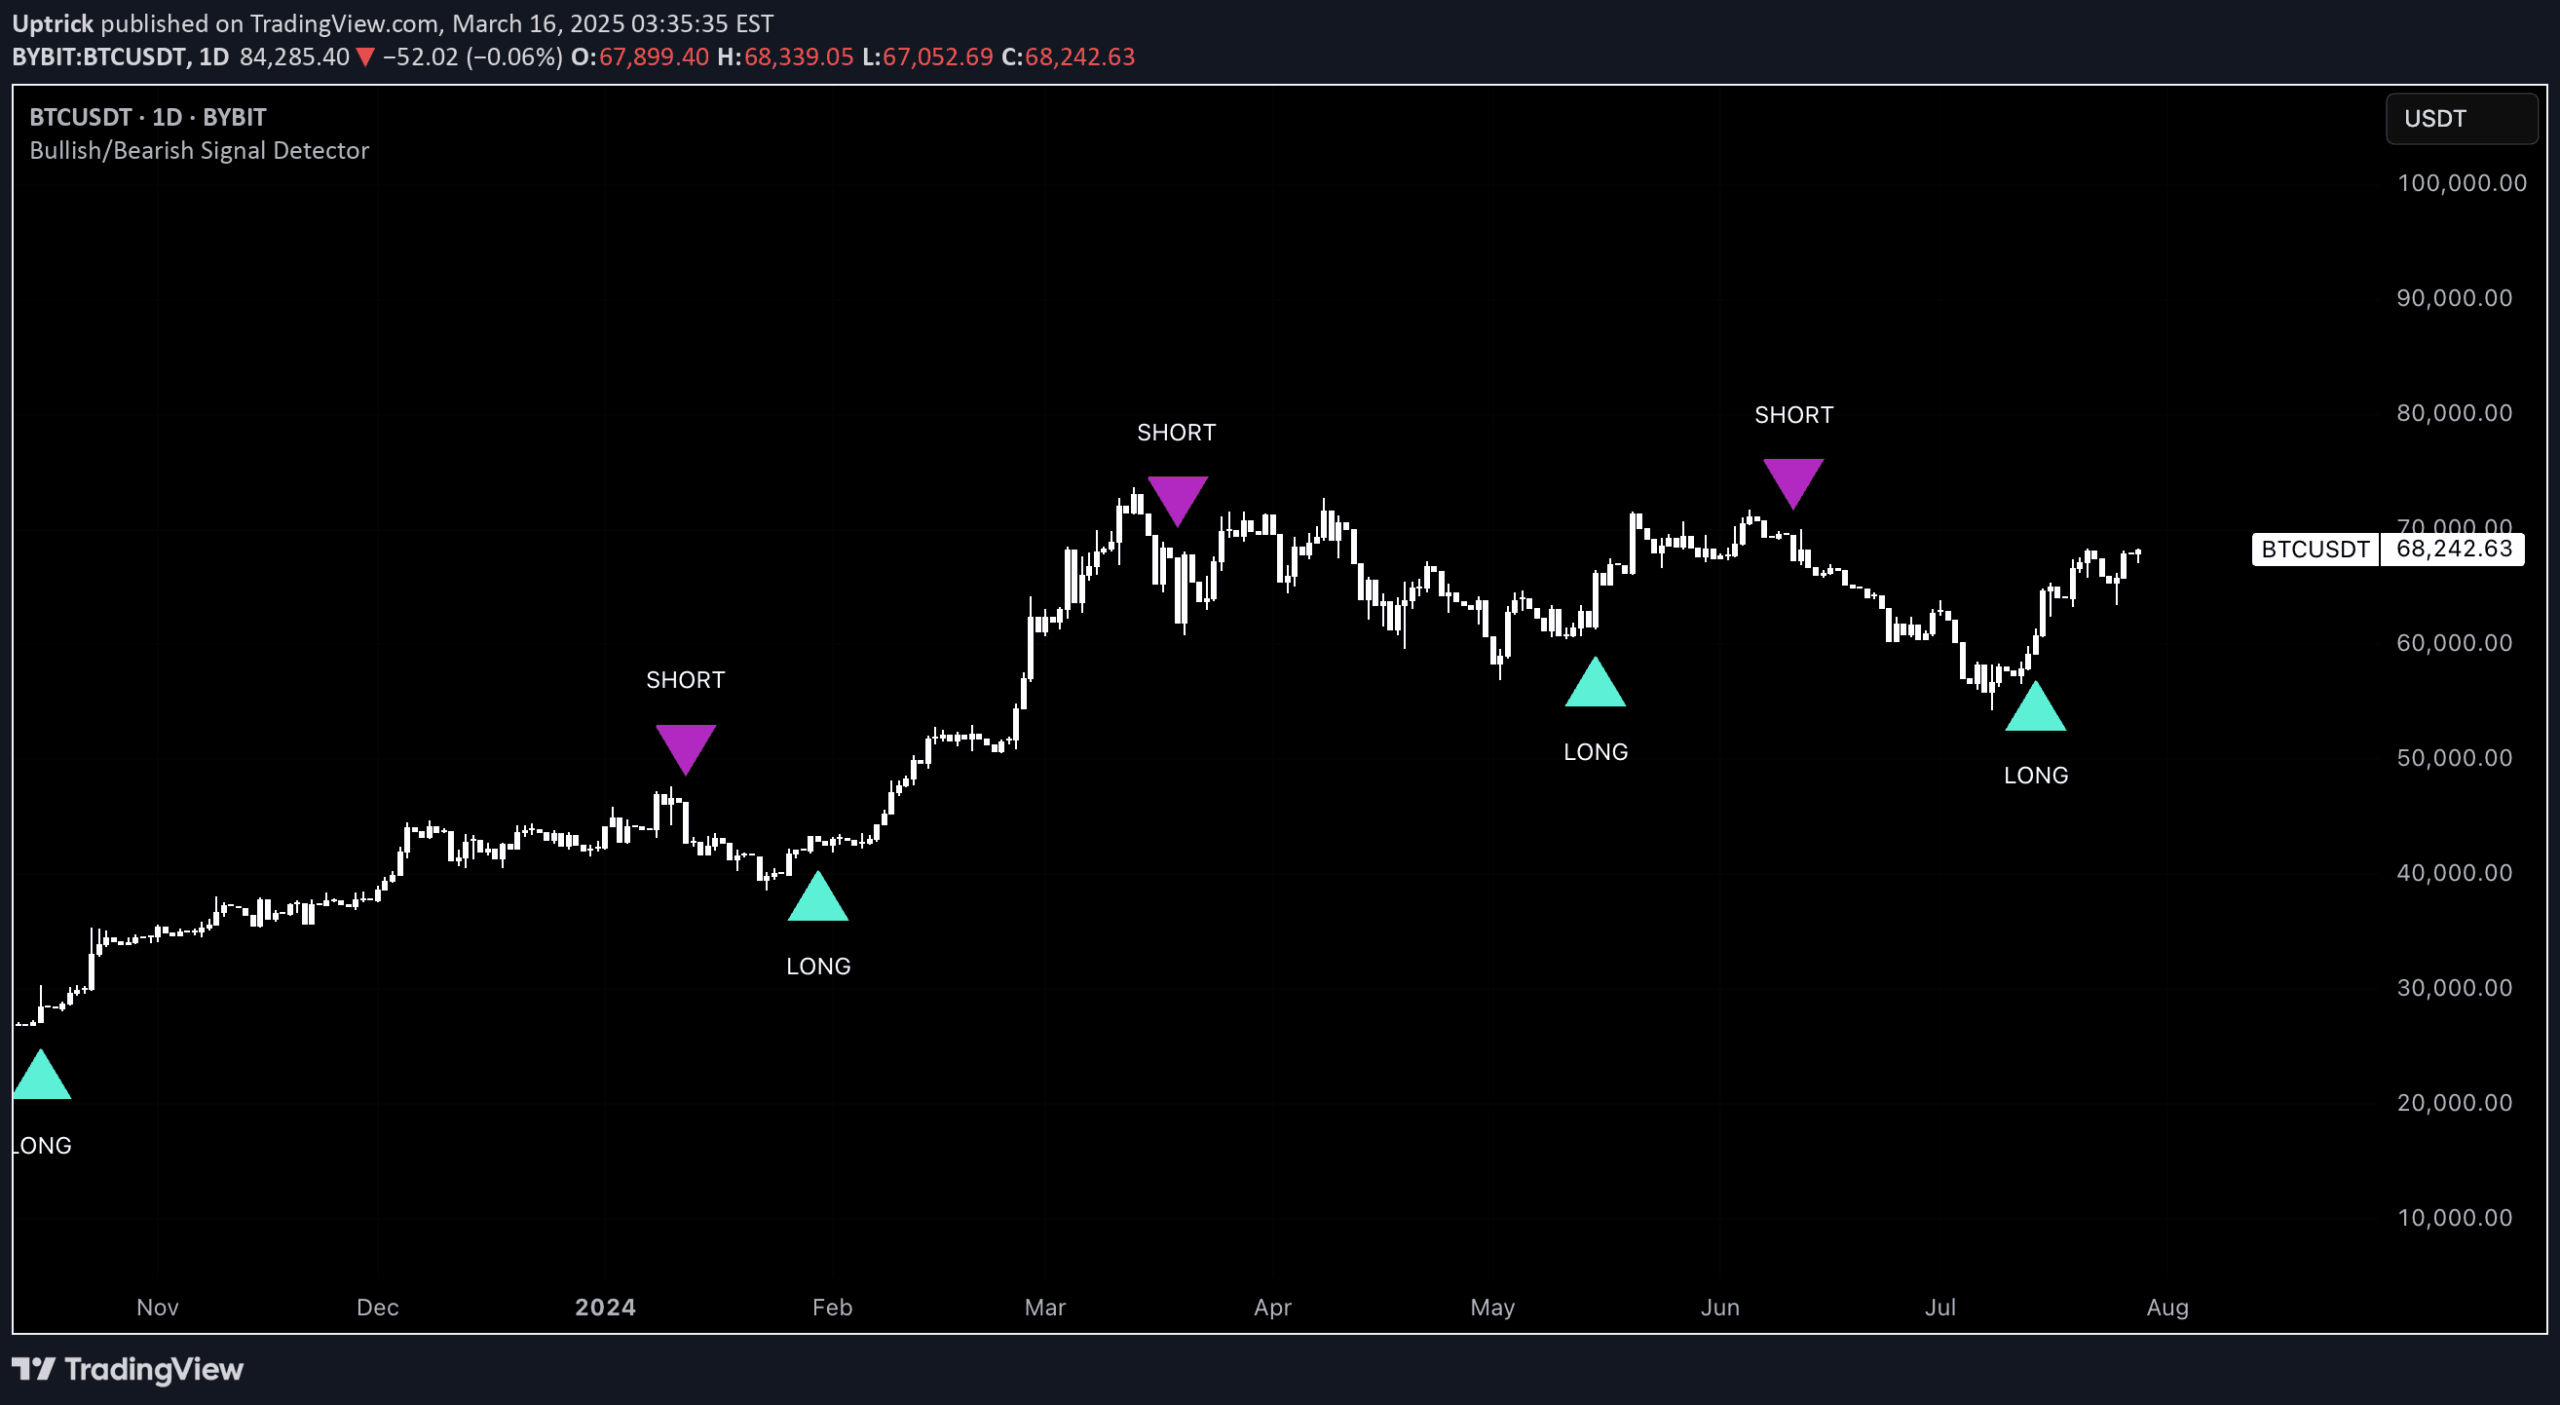
A trading script that combines MACD and RSI to detect bullish and bearish signals, providing traders with automated entry and exit points based on momentum and trend strength.
Explore complementary indicator rolesHow it works
The script calculates the MACD histogram and RSI indicator for each price bar, analyzing market momentum and relative strength. It defines specific conditions for bullish and bearish signals: a positive MACD histogram with RSI above 50 indicates a bullish trend, while a negative MACD histogram with RSI below 50 suggests a bearish trend.
As new price data arrives, the script processes each bar and checks if the current market conditions meet the predefined signal criteria. When a signal is detected and differs from the previous signal, a label is automatically plotted on the chart, indicating 'LONG' or 'SHORT' opportunities for traders to consider.
Why it may be useful
By combining two powerful technical indicators, this script offers a more robust method for identifying potential market trends and reversals. The MACD provides insight into momentum, while the RSI confirms the strength of price movements, reducing the likelihood of false signals and enhancing trading decision-making.
The automated signal detection eliminates the need for manual indicator analysis, allowing traders to quickly spot potential entry and exit points. Its customizable features enable traders to adapt the script to their specific trading strategy, making it a versatile tool for different market conditions and trading styles.
When to explore it
This signal detector works best in markets with clear trending characteristics, where momentum and relative strength indicators can effectively capture price movements. It is particularly useful in liquid markets with sufficient price volatility, such as major stock indices, forex pairs, and actively traded commodities.
Traders should use this script as a complementary tool alongside other technical and fundamental analysis methods. It is most effective when applied to timeframes ranging from intraday to swing trading, and can be adjusted to suit individual risk tolerance and trading preferences.
Keep exploring
What we’ve verified
Access, alerts and repainting behaviour have not been independently verified for this indicator. Check the creator’s current publication and settings.
General descriptions and classifications are recovered research. Verified details above identify the specific checks we have completed. Check the creator’s current publication for later changes.


