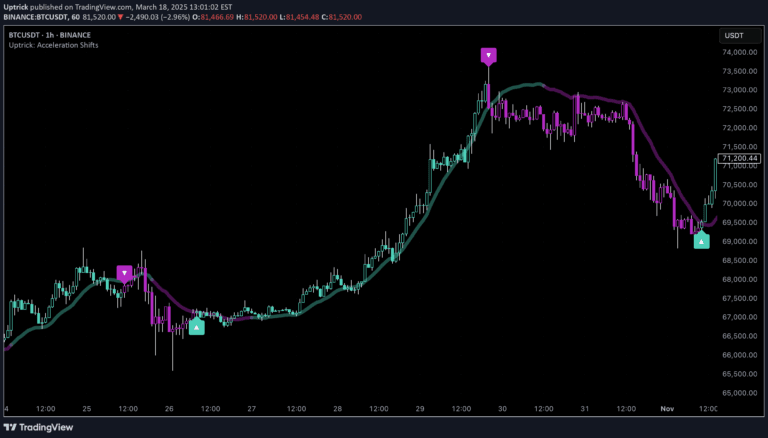
A dynamic trading signal using z-score bands and RSI momentum to identify mean-reversion opportunities with adaptive statistical filtering and robust entry confirmation.
Explore complementary indicator rolesHow it works
The Z-Trend Bands indicator calculates a fair-value exponential moving average (EMA) and then measures price deviations using standardized z-scores. By converting price movements into statistical probabilities, it dynamically creates upper and lower bands that automatically adjust to current market volatility.
The system further refines entry signals by analyzing the RSI momentum slope, ensuring that only genuine trend reversals trigger trade markers. This dual-filter approach smooths out raw price and momentum data, creating a disciplined method that locks out duplicate signals until true momentum shifts occur.
Why it may be useful
Traditional trading indicators often rely on static thresholds that fail during changing market conditions, creating false signals and potential losses. This indicator solves that problem by using normalized z-scores that represent statistically rare price movements, giving traders a more adaptive and precise entry mechanism.
By combining multiple confirmation layers - price reentry, momentum slope, and signal memory - the tool dramatically reduces noise-driven trades. The transparent scoring table and configurable visual modes provide traders with deep insight into each signal's components, enabling more informed and confident trading decisions.
When to explore it
The Z-Trend Bands signal works best in short-term, lower-timeframe charts where mean-reversion strategies are most effective. It is particularly suited for markets with moderate volatility, where price tends to oscillate around a central value, such as forex, futures, and certain stock indices.
Traders should prioritize this indicator when seeking high-probability entries during range-bound or consolidating market conditions. It is most powerful when combined with additional confirmation from volume, support/resistance levels, and broader market context, making it a valuable tool for disciplined, statistically-driven traders.
Keep exploring
What we’ve verified
Access, alerts and repainting behaviour have not been independently verified for this indicator. Check the creator’s current publication and settings.
General descriptions and classifications are recovered research. Verified details above identify the specific checks we have completed. Check the creator’s current publication for later changes.