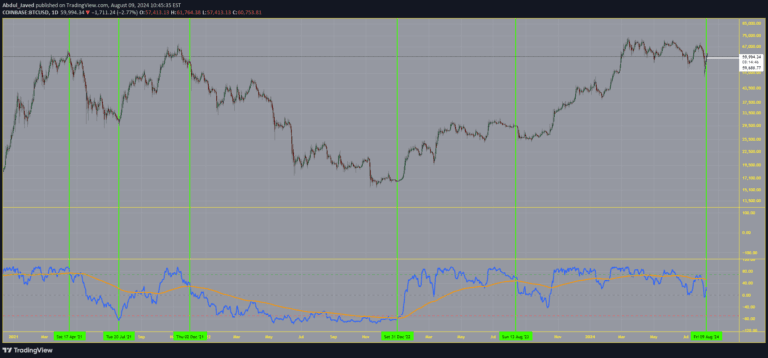
A dynamic momentum indicator that analyzes price rate of change using dual exponential moving averages, providing multi-timeframe momentum insights with trend identification and visualization.
Explore complementary indicator rolesHow it works
The Kinetic Price Momentum Oscillator (Kinetic-PMO) calculates momentum by first measuring the rate of change over one bar. It then applies a dual exponential moving average (EMA) smoothing process, with the first EMA smoothing the rate of change and the second EMA further refining the result.
The indicator creates a main KPMO line by multiplying the smoothed rate of change by 10 for scaling. A third EMA is applied to the KPMO line to generate a signal line, which helps identify momentum trends and potential trend reversals across multiple timeframes.
Why it may be useful
The Kinetic-PMO provides traders with a sophisticated tool for understanding market momentum dynamics by offering a nuanced view of price movement beyond simple directional indicators. Its multi-timeframe approach allows traders to simultaneously analyze momentum across different time horizons, providing a more comprehensive market perspective.
By incorporating customizable smoothing parameters and sensitivity factors, the indicator adapts to various market conditions and trading styles. The visual enhancements, such as color-coded trend identification and optional ribbon fills, make it easier for traders to quickly interpret momentum shifts and potential trading opportunities.
When to explore it
The Kinetic-PMO is most effective in markets with clear trending characteristics, where momentum plays a significant role in price movement. It performs particularly well in liquid markets with sufficient price volatility, such as major forex pairs, stock indices, and actively traded commodities.
Traders can leverage this indicator for trend confirmation, detecting potential momentum divergences, and refining entry and exit points. It is especially useful when combined with other technical analysis tools to validate signals and reduce false positives in trading decision-making.
Keep exploring
What we’ve verified
Access, alerts and repainting behaviour have not been independently verified for this indicator. Check the creator’s current publication and settings.
General descriptions and classifications are recovered research. Verified details above identify the specific checks we have completed. Check the creator’s current publication for later changes.