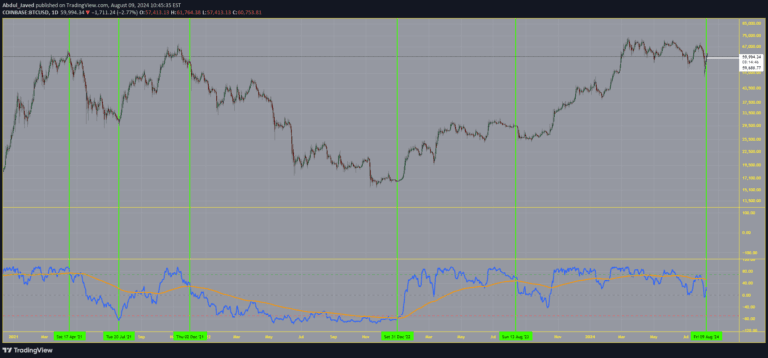
A momentum-based probability indicator combining MFI, Stochastics, and RSI to assess market sentiment and potential price movements across different timeframes.
Explore complementary indicator rolesHow it works
The indicator calculates an average of three momentum indicators: Money Flow Index (MFI), Stochastics, and Relative Strength Index (RSI). It creates an independent oscillator that tracks bullish and bearish instances by comparing price movements from open to high and open to low.
The oscillator plots maximum bullish values at the top, minimum bearish values at the bottom, and average values in between. A threshold value is calculated, which serves as a key reference point for market sentiment, with values above the threshold considered bullish and below considered bearish.
Why it may be useful
This multi-indicator approach provides traders with a comprehensive view of market momentum by combining three powerful technical indicators into a single, easy-to-interpret oscillator. By consolidating MFI, Stochastics, and RSI, traders can gain deeper insights into market sentiment and potential price movements.
The indicator offers additional context through its ability to show time spent in bullish or bearish ranges, calculate average price ranges using ATR techniques, and display specific technical levels for each underlying indicator. This comprehensive analysis helps traders make more informed trading decisions.
When to explore it
The indicator is most effective on smaller timeframes, particularly during periods of market choppiness, to assess overall market sentiment and potential price direction. It works best during regular trading hours (RTH) with extended trading hours (ETH) turned off.
Traders can utilize this indicator to identify potential support and resistance levels, look for divergences, and gain a nuanced understanding of market momentum. It is particularly useful for traders seeking a consolidated view of multiple momentum indicators in a single, easy-to-interpret oscillator.
Keep exploring
What we’ve verified
Access, alerts and repainting behaviour have not been independently verified for this indicator. Check the creator’s current publication and settings.
General descriptions and classifications are recovered research. Verified details above identify the specific checks we have completed. Check the creator’s current publication for later changes.