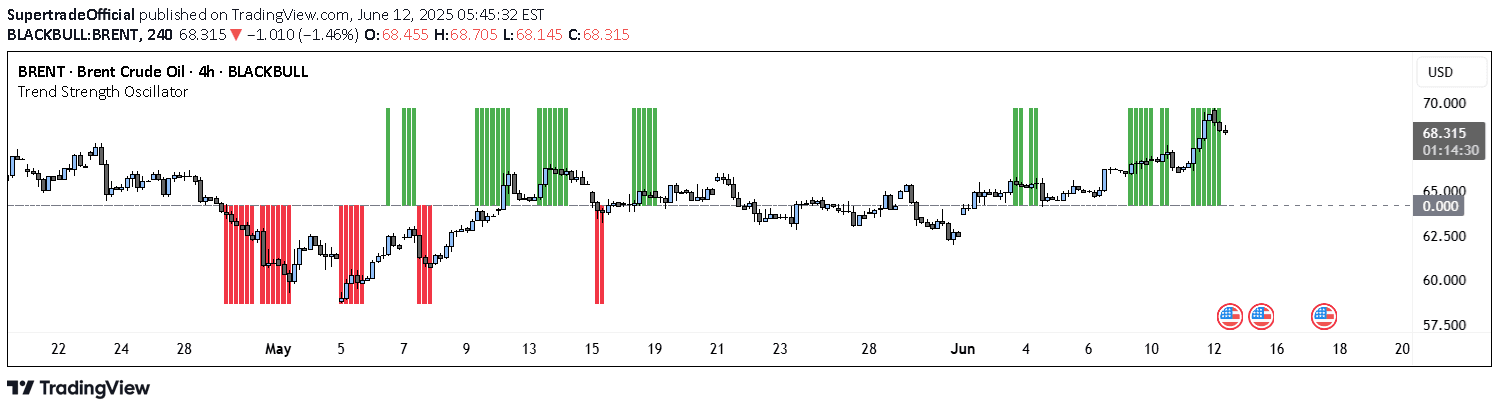
A custom indicator combining Stochastic Momentum Index (SMI) with a signal line, offering faster trend identification and potential entry/exit points similar to MACD.
Explore complementary indicator rolesHow it works
The indicator operates like the True Strength Index, incorporating a Stochastic Momentum Index (SMI) with an additional signal line. It calculates momentum by comparing closing prices to a range of prices over a specific period, creating an oscillating line that moves within predefined boundaries.
The signal line, based on an Exponential Moving Average (EMA), provides additional confirmation of trend changes. When the SMI line crosses the signal line, it generates potential trade entry or exit points, helping traders identify momentum shifts more quickly than traditional indicators.
Why it may be useful
This indicator offers traders a more responsive tool for identifying market momentum and potential trend reversals. By combining the SMI with a signal line, it provides faster insights than standard MACD, allowing for more timely trading decisions and reduced lag in trend recognition.
The inclusion of adjustable overbought and oversold zones enhances its versatility, enabling traders to customize the indicator to their specific risk tolerance and trading style. The added histogram further visualizes momentum changes, making trend analysis more intuitive and accessible.
When to explore it
The indicator is most effective in markets with clear momentum trends and during periods of moderate volatility. It works particularly well for short-term trading strategies, such as scalping and day trading, where quick trend identification is crucial for capturing rapid price movements.
Traders should be cautious of potential false signals, especially during choppy or range-bound market conditions. It's most reliable when used in conjunction with other technical indicators and fundamental analysis to confirm potential trade setups.
Keep exploring
What we’ve verified
Access, alerts and repainting behaviour have not been independently verified for this indicator. Check the creator’s current publication and settings.
General descriptions and classifications are recovered research. Verified details above identify the specific checks we have completed. Check the creator’s current publication for later changes.