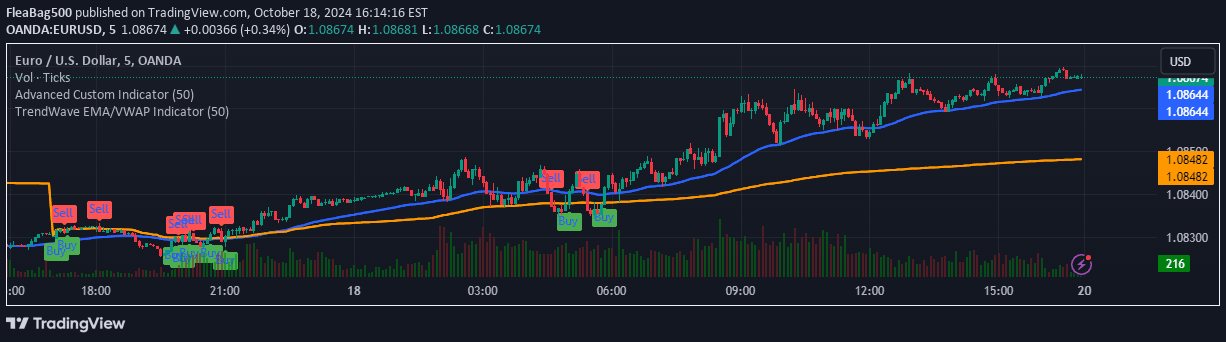
A custom EMA indicator displaying 50, 100, and 200 exponential moving averages to help traders identify market trends, support/resistance levels, and potential reversals.
Explore complementary indicator rolesHow it works
The Advanced EMA Indicator calculates three different exponential moving averages (50, 100, and 200 periods) using selected price data. These moving averages smooth out price fluctuations, creating dynamic trend lines that adapt quickly to recent price changes.
By plotting these EMAs on the chart, traders can visually track the short, medium, and long-term trends. The indicator allows customization of price sources, line styles, and colors, enabling traders to personalize the visual representation of market momentum and trend strength.
Why it may be useful
EMAs are crucial tools for understanding market dynamics, providing traders with a clear visualization of trend direction and potential trend changes. They help traders distinguish between bullish and bearish market conditions by showing the relationship between different timeframe trends.
By offering multiple EMA lengths, this indicator allows traders to gain comprehensive insights into market momentum across different time horizons. The ability to customize colors and styles makes the indicator adaptable to various trading styles and personal preferences.
When to explore it
The Advanced EMA Indicator is most effective in trending markets where price shows clear directional movement. Traders can use it to confirm trend strength, identify potential entry and exit points, and align their trades with the dominant market trend.
It is particularly useful when analyzing higher timeframe charts to understand longer-term market dynamics. Traders can leverage EMA crossovers, rejections, and angle of slope to make more informed trading decisions across different market conditions and trading styles.
Keep exploring
What we’ve verified
Access, alerts and repainting behaviour have not been independently verified for this indicator. Check the creator’s current publication and settings.
General descriptions and classifications are recovered research. Verified details above identify the specific checks we have completed. Check the creator’s current publication for later changes.