
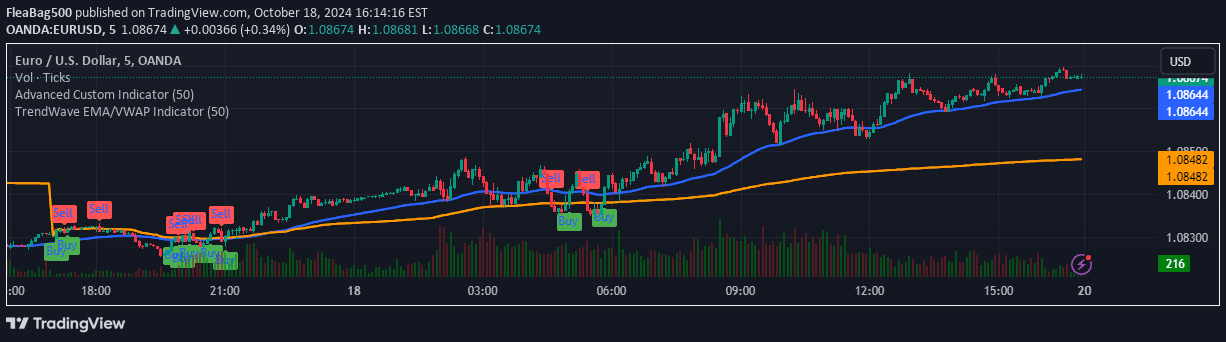
A technical analysis tool combining Exponential Moving Average and Volume Weighted Average Price to identify market trends and generate precise trading signals based on price and volume interactions.
Explore complementary indicator rolesHow it works
The TrendWave EMA/VWAP Indicator operates by integrating two powerful technical analysis components: the Exponential Moving Average and the Volume Weighted Average Price. The EMA calculates a dynamic moving average that gives more weight to recent price data, creating a responsive trend line that adapts quickly to current market conditions. This component helps traders identify the overall trend direction by smoothing out price fluctuations and highlighting the prevailing market momentum.
The VWAP complements the EMA by calculating the average price weighted by trading volume throughout the day. When the current price crosses above or below the VWAP, the indicator generates clear buy or sell signals. These signals are visually represented by intuitive arrows on the chart, allowing traders to quickly recognize potential trading opportunities and make informed decisions based on price and volume interactions.
Why it may be useful
The TrendWave EMA/VWAP Indicator provides traders with a comprehensive view of market dynamics by combining trend analysis and volume-weighted pricing. By integrating the EMA's trend identification capabilities with VWAP's volume-based insights, traders can gain a more nuanced understanding of market movements and potential price trajectories. The indicator helps traders filter out market noise and focus on significant price actions that are supported by meaningful trading volume.
Moreover, the indicator's ability to generate clear buy and sell signals based on price and VWAP interactions makes it an invaluable tool for traders across different timeframes and trading styles. Its customizable nature allows traders to adapt the indicator to their specific preferences, enabling more precise and confident trading decisions. The visual representation of signals and color-coded components enhance traders' ability to quickly interpret market conditions and potential trading opportunities.
When to explore it
The TrendWave EMA/VWAP Indicator is most effective in markets with consistent trading volume and clear directional movements. It performs exceptionally well in liquid markets such as major stock indices, forex pairs, and heavily traded commodities where volume data provides meaningful insights. Traders can leverage this indicator during trending market conditions, where price movements are more predictable and volume confirms the underlying trend.
The indicator is particularly useful during key market sessions with high trading activity, such as stock market open and close, or during economic news releases that generate significant market interest. Traders should be cautious during periods of extreme market volatility or low trading volume, where signals might be less reliable. By combining this indicator with other technical analysis tools and fundamental research, traders can develop more robust and comprehensive trading strategies across various timeframes and market conditions.
Keep exploring
What we’ve verified
Access, alerts and repainting behaviour have not been independently verified for this indicator. Check the creator’s current publication and settings.
General descriptions and classifications are recovered research. Verified details above identify the specific checks we have completed. Check the creator’s current publication for later changes.



