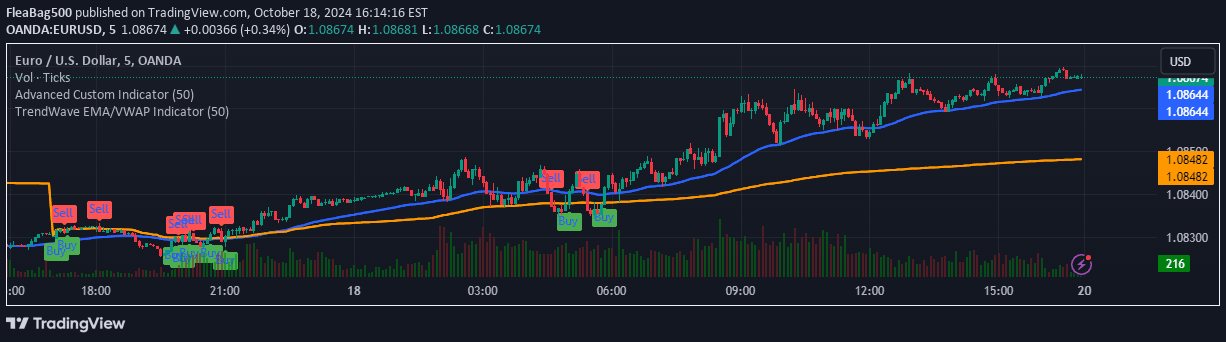
A price deviation indicator using a 200-period EMA z-score to measure how far current price is from its long-term average, helping traders identify potential overbought or oversold conditions.
Explore complementary indicator rolesHow it works
The Price vs. 200 MA (EMA) Indicator calculates a standardized difference between the current price and its 200-period Exponential Moving Average by converting the raw difference into a z-score. This process involves measuring how many standard deviations the price is away from the long-term moving average, which provides a normalized perspective on price deviation.
By tracking these standardized differences, the indicator creates a color-coded visual representation that helps traders quickly identify when prices are significantly diverging from their typical long-term trend. When the z-score reaches extreme levels like above +2 or below -2, it signals potential overbought or oversold conditions in the market.
Why it may be useful
This indicator provides traders with a sophisticated method of understanding price movements beyond simple moving average comparisons by normalizing the deviation relative to historical price volatility. By transforming raw price differences into standardized units, traders can make more informed decisions about potential trend reversals, mean reversion opportunities, and market extremes.
The z-score approach allows for a more nuanced interpretation of price action, helping traders distinguish between normal market fluctuations and truly significant price movements. This method reduces the risk of false signals by considering the asset's inherent volatility and providing a more contextual view of price behavior.
When to explore it
The Price vs. 200 MA (EMA) Indicator works best in trending markets where prices have clear directional movements and consistent volatility patterns. Traders can utilize this signal most effectively when looking to identify potential entry and exit points during trend continuation or potential reversal scenarios.
The indicator is particularly useful during periods of market volatility, where understanding the relative extremity of price movements becomes crucial. It can be applied across various timeframes and asset classes, making it a versatile tool for traders seeking to normalize and contextualize price deviations from long-term averages.
Keep exploring
What we’ve verified
Access, alerts and repainting behaviour have not been independently verified for this indicator. Check the creator’s current publication and settings.
General descriptions and classifications are recovered research. Verified details above identify the specific checks we have completed. Check the creator’s current publication for later changes.