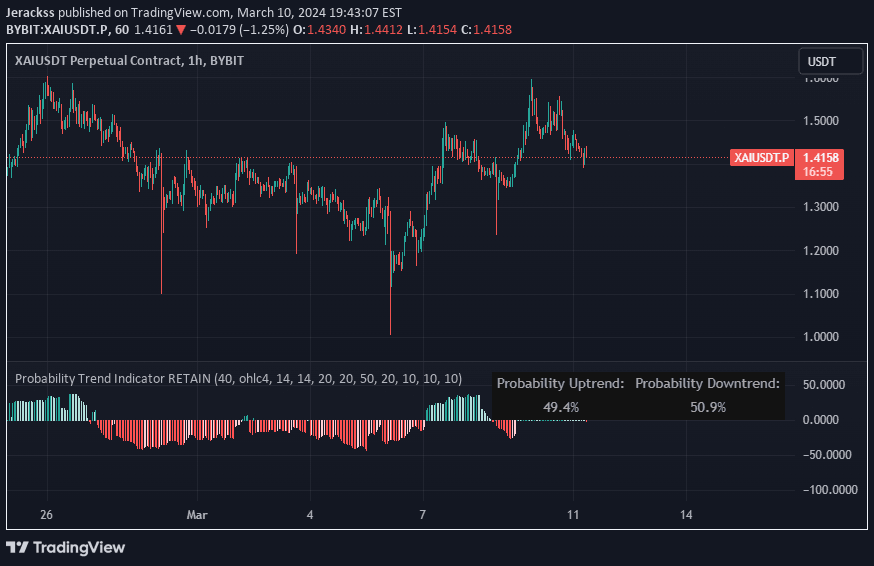
A custom oscillator-based trend indicator that identifies market momentum shifts using EMA and RMA calculations, providing visual buy and sell signals with color-coded background trends.
Explore complementary indicator rolesHow it works
The Trend Indicator calculates momentum by first smoothing the price data using an Exponential Moving Average (EMA), which reduces market noise and creates a baseline for analysis. It then generates an oscillator value by comparing the smoothed price to a Simple Moving Average (SMA), measuring the relative strength and direction of price movement.
The indicator further refines the analysis by creating a Signal Line, which is a Simple Moving Average of the oscillator. When the oscillator crosses above or below zero, it triggers buy or sell signals, with the Signal Line providing additional confirmation of potential trend changes.
Why it may be useful
This indicator helps traders identify potential trend reversals and momentum shifts by providing clear visual cues about market direction. By smoothing price data and creating an oscillating indicator, it cuts through market noise and offers traders a structured approach to understanding price movements.
The combination of color-coded backgrounds, buy/sell markers, and oscillator tracking allows traders to quickly assess market conditions without extensive manual analysis. It transforms complex price data into an intuitive, easy-to-read format that supports more informed trading decisions.
When to explore it
The Trend Indicator is most effective in markets with clear directional movement, where momentum shifts can be reliably detected. It works particularly well in trending markets where price has a consistent directional bias, allowing traders to capitalize on sustained moves in either direction.
Traders should use this indicator in conjunction with other technical analysis tools to confirm signals and manage risk. It is especially useful for identifying potential entry and exit points in various timeframes, from short-term scalping to longer-term swing trading strategies.
Keep exploring
What we’ve verified
Access, alerts and repainting behaviour have not been independently verified for this indicator. Check the creator’s current publication and settings.
General descriptions and classifications are recovered research. Verified details above identify the specific checks we have completed. Check the creator’s current publication for later changes.