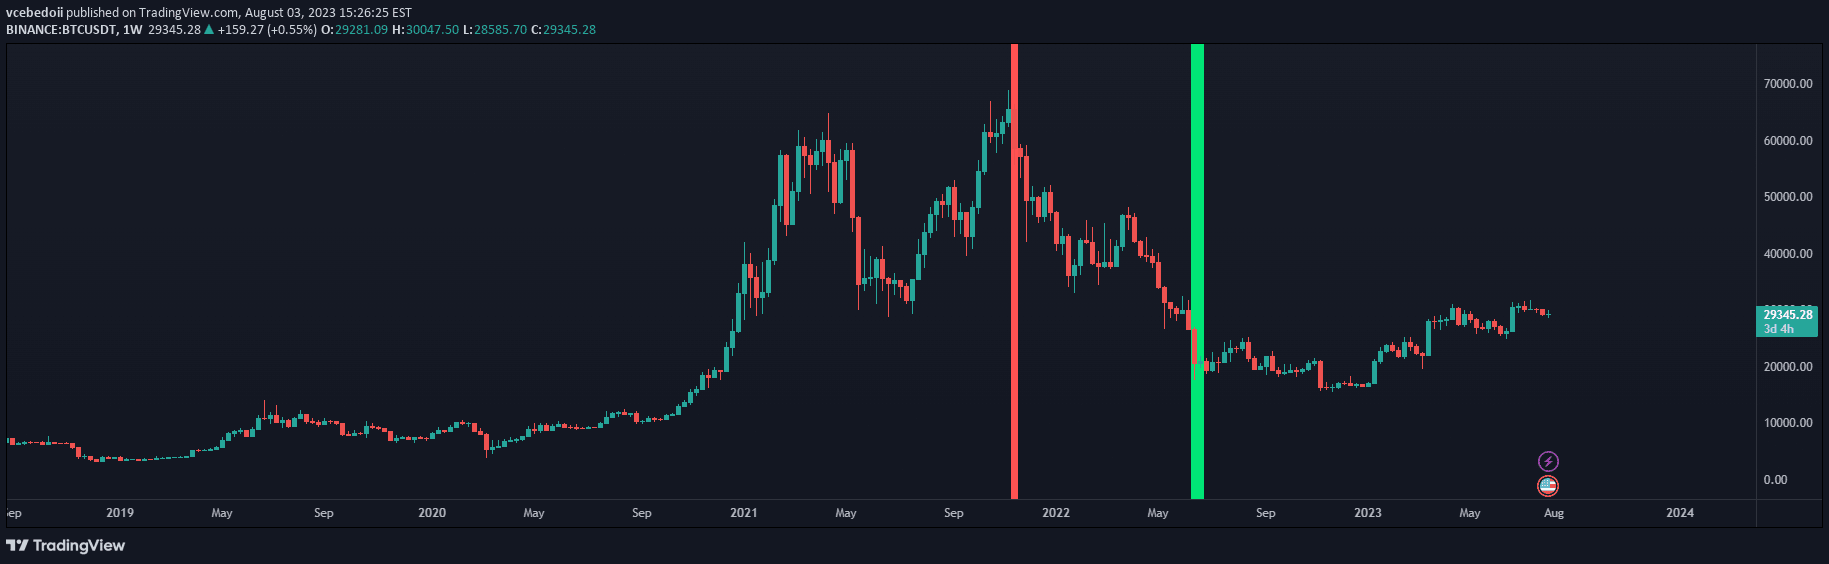
A moving average-based reversal indicator that generates trading signals by tracking market price position relative to a 13-period moving average, identifying potential trend changes.
Explore complementary indicator rolesHow it works
K's Reversal Indicator II utilizes a 13-period moving average as its foundational calculation method. The indicator tracks how many periods the market price remains above this moving average, creating a unique tracking mechanism for potential trend reversals.
When the count of periods above the moving average reaches 21, the system generates a bearish signal, indicating a potential downward trend. Conversely, when the count drops to zero, a bullish signal is produced, suggesting a potential upward price movement and mean-reversion opportunity.
Why it may be useful
This indicator provides traders with a systematic approach to identifying potential market turning points by quantifying price behavior relative to a moving average. By transforming price movement into a structured count-based signal, it offers a more nuanced view of market dynamics beyond traditional technical analysis methods.
The signal's strength lies in its ability to capture short-term to mid-term reversal opportunities, helping traders anticipate potential trend changes before they become fully established. This approach can provide early warning signs of market sentiment shifts and potential entry or exit points.
When to explore it
K's Reversal Indicator II is most effective in markets with moderate volatility and clear trending characteristics. It works best when price movements show consistent patterns around the moving average, allowing the count-based system to generate reliable signals.
Traders should be cautious in highly erratic or range-bound markets where price fluctuations might create false signals. The indicator is particularly useful for day traders and swing traders looking to capture mean-reversion moves and potential trend reversals in various financial instruments.
Keep exploring
What we’ve verified
Access, alerts and repainting behaviour have not been independently verified for this indicator. Check the creator’s current publication and settings.
General descriptions and classifications are recovered research. Verified details above identify the specific checks we have completed. Check the creator’s current publication for later changes.