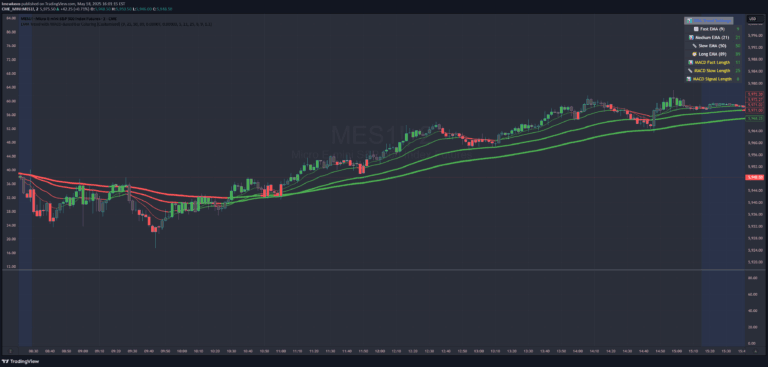
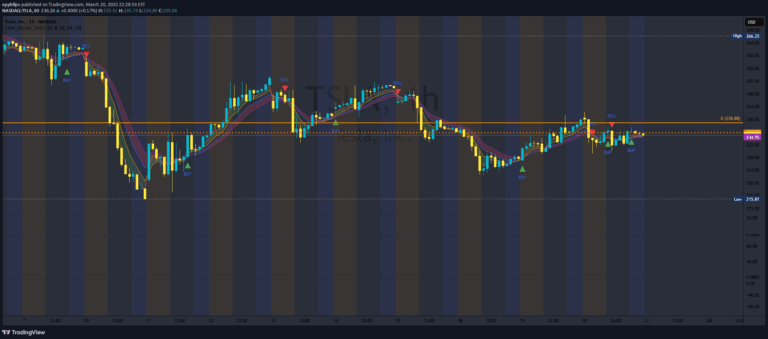
A dynamic candle color indicator using multiple Exponential Moving Averages (EMAs) to visually represent market trend strength and momentum across different timeframes.
Explore complementary indicator rolesHow it works
The Stacked EMA Candle Colors indicator analyzes the relative positioning of four exponential moving averages with different lengths. When shorter EMAs are positioned above longer EMAs, the candles turn green with varying intensity based on momentum strength.
Conversely, when shorter EMAs are below longer EMAs, candles turn red, indicating a bearish trend. The color gradient provides immediate visual feedback about trend direction and momentum. Each candle's color is dynamically calculated based on the EMA stack, offering traders a quick way to understand market sentiment without additional chart clutter
Why it may be useful
This indicator simplifies trend analysis by transforming complex moving average relationships into an intuitive color-coded system. Traders can quickly assess market momentum without performing manual calculations or comparing multiple EMA lines.
The gradient-based coloring provides nuanced information about trend strength, helping traders make faster and more informed decisions. By visualizing EMA stacking, traders can identify potential trend changes, confirm existing trends, and filter out neutral market conditions more efficiently
When to explore it
The Stacked EMA Candle Colors indicator works best in trending markets with clear directional movements. It is particularly effective for day traders and swing traders seeking quick trend confirmation across various asset classes and timeframes.
Traders should use this indicator in conjunction with other technical analysis tools to validate signals. It performs well in markets with consistent momentum, such as stocks, forex, and cryptocurrencies. The indicator is most reliable when market conditions allow for sustained trends rather than choppy, range-bound scenarios
Keep exploring
What we’ve verified
Access, alerts and repainting behaviour have not been independently verified for this indicator. Check the creator’s current publication and settings.
General descriptions and classifications are recovered research. Verified details above identify the specific checks we have completed. Check the creator’s current publication for later changes.