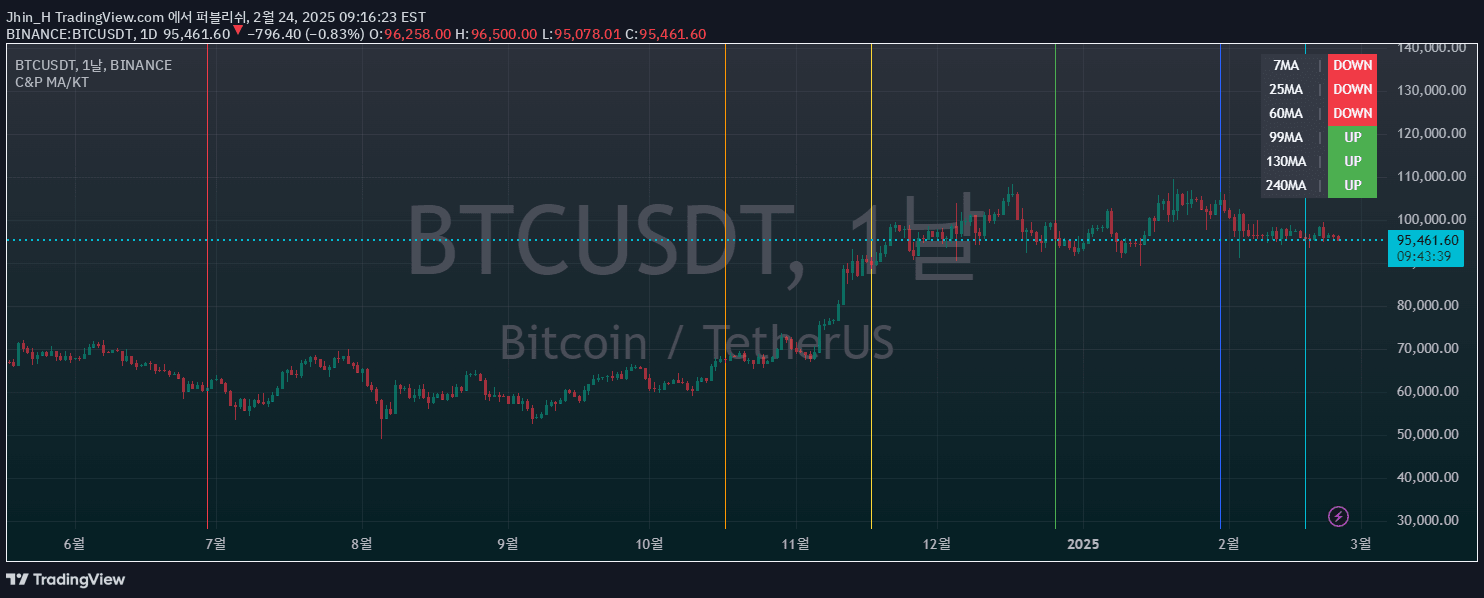
A multi-timeframe Simple Moving Average (SMA) indicator that calculates and visualizes moving averages across six different timeframes and periods.
Explore complementary indicator rolesHow it works
The Multi-Timeframe SMA Table & Plot calculates Simple Moving Averages (SMAs) using three different periods: 10, 60, and 223, across six timeframes ranging from 1-minute to 60-minute intervals. Each SMA is computed by averaging the closing prices over its specific period, creating a smoothed trend line that helps identify market direction and momentum.
The indicator generates a color-coded table and chart overlay, with yellow representing the 10-period SMA, blue for the 60-period SMA, and purple for the 223-period SMA. By plotting these SMAs directly on the price chart, traders can visually analyze how different moving averages interact with current price movements and identify potential trend changes.
Why it may be useful
Multi-timeframe SMA analysis provides traders with a comprehensive view of market trends across different time horizons, helping to reduce the risk of making decisions based on a single timeframe perspective. By comparing SMAs from multiple periods, traders can gain deeper insights into market dynamics, potential trend reversals, and overall market sentiment.
The color-coded table and chart visualization make it easier for traders to quickly interpret complex trend information, allowing for more informed and strategic trading decisions. This approach helps traders identify potential support and resistance levels, confirm trend directions, and develop more robust trading strategies.
When to explore it
This indicator is most effective during trending market conditions, where clear directional movements can be identified across multiple timeframes. Traders can use the Multi-Timeframe SMA Table & Plot to confirm trend strength, detect potential trend reversals, and validate entry and exit points for various trading strategies.
The indicator is particularly useful for traders who want to develop a comprehensive market analysis approach, combining short-term and long-term trend perspectives. It can be applied across different asset classes and trading styles, providing valuable insights for scalpers, day traders, and swing traders seeking to make more informed trading decisions.
Keep exploring
What we’ve verified
Access, alerts and repainting behaviour have not been independently verified for this indicator. Check the creator’s current publication and settings.
General descriptions and classifications are recovered research. Verified details above identify the specific checks we have completed. Check the creator’s current publication for later changes.