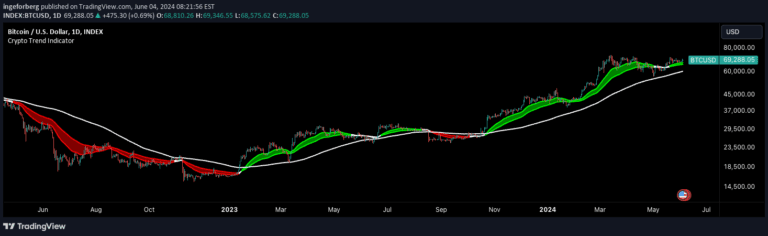
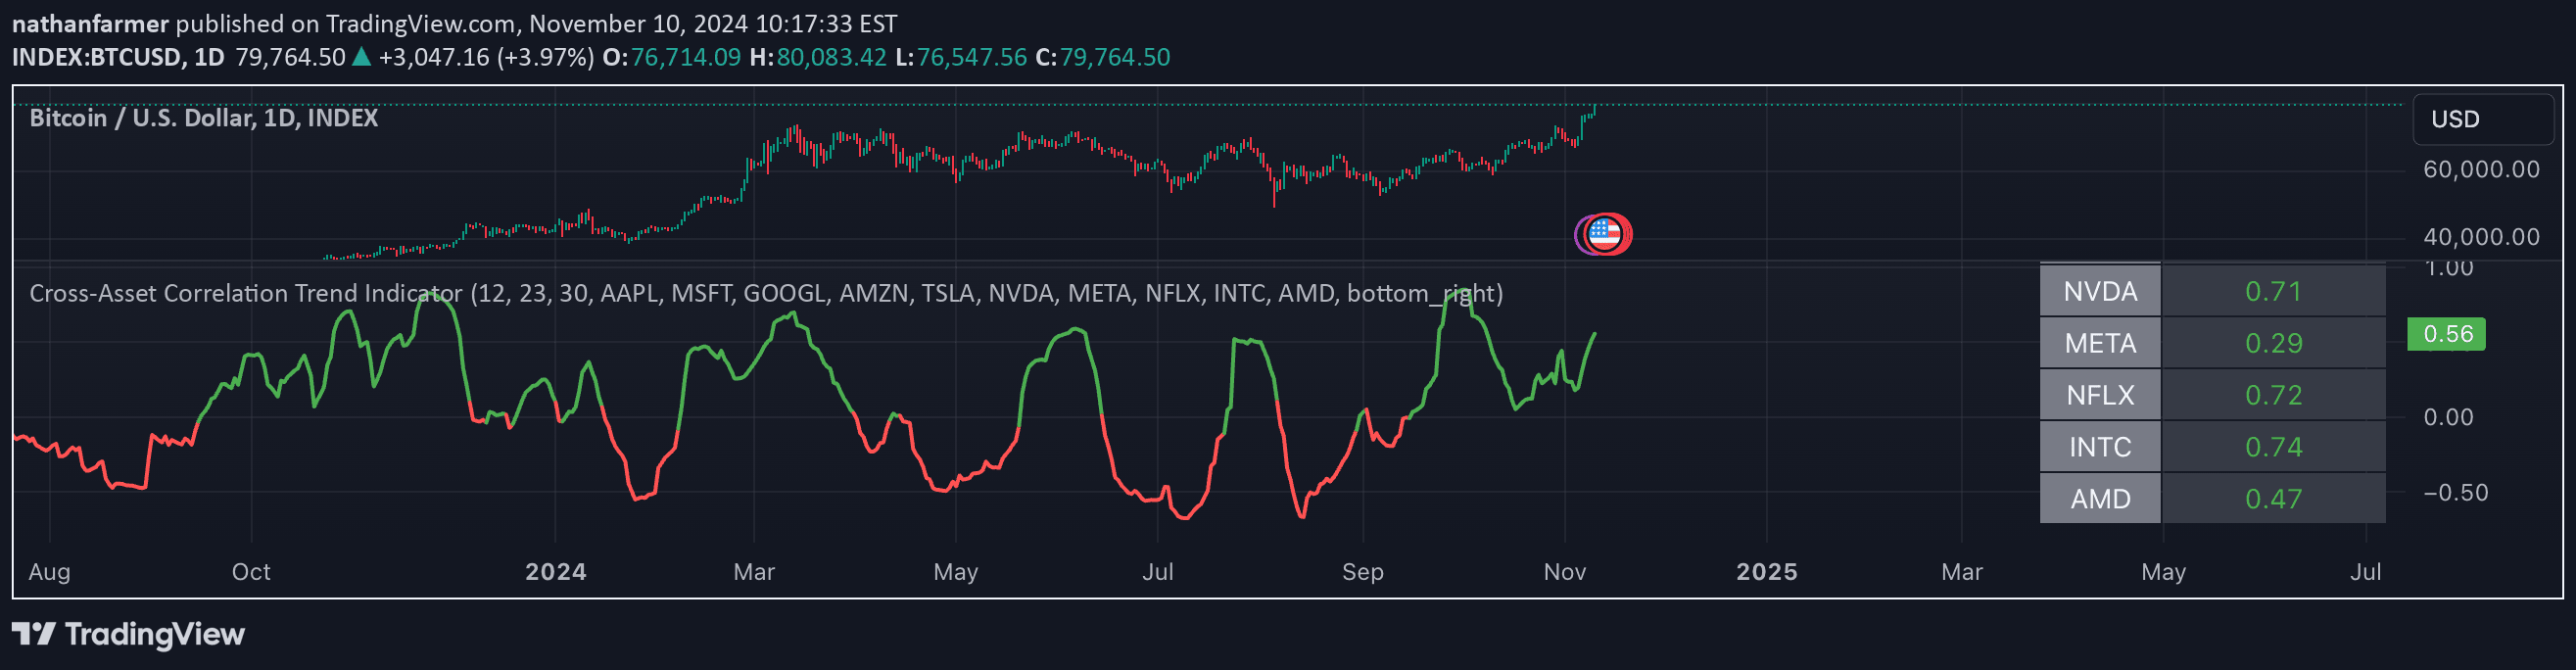
A comprehensive trend-following indicator using moving averages to identify bullish and bearish market trends across different timeframes with color-coded visual alerts.
Explore complementary indicator rolesHow it works
The Trend Change Indicator operates by analyzing the interaction between 30-day and 60-day Exponential Moving Averages (EMA) across multiple timeframes. When the 30-day EMA rises above the 60-day EMA, it generates a green bullish signal, and when it falls below, it creates a red bearish signal. The indicator also incorporates a 140-day Simple Moving Average (SMA) with predictive dots to provide additional trend insights.
The tool monitors both hourly and daily charts, with the 4-hour timeframe offering early trend change signals. Gray alerts appear when EMAs converge near the Average True Range safety margin, indicating potential trend shifts. The SMA's slope and positioning relative to price help traders understand long-term trend dynamics and potential future price movements.
Why it may be useful
The Trend Change Indicator is crucial for investors seeking to understand and anticipate market trends with a comprehensive, user-friendly approach. By providing color-coded visual representations of trend movements, it helps traders quickly interpret complex price dynamics across different timeframes. The integration of multiple moving averages and predictive elements offers a nuanced view of potential trend directions.
Its value lies in simplifying trend analysis and risk management, making it accessible to both novice and experienced traders. The indicator's ability to project trend movements through SMA dots and highlight potential shifts through color-coded signals enables more informed decision-making. This tool is particularly beneficial for managing investment strategies in trending markets like cryptocurrencies, tech stocks, and commodities.
When to explore it
The Trend Change Indicator is most effective in markets that demonstrate strong, consistent trending behavior. It performs exceptionally well in assets with clear directional movements, such as cryptocurrencies, technology stocks, and commodity markets. Traders should focus on using this indicator when price movements show sustained momentum in either bullish or bearish directions.
While powerful, the indicator should not be used in isolation. It is recommended to combine it with other technical analysis tools to validate signals and create a more comprehensive trading strategy. Markets with high volatility or choppy price action might generate less reliable signals, so traders should exercise caution and use additional confirmation methods.
Keep exploring
What we’ve verified
Access, alerts and repainting behaviour have not been independently verified for this indicator. Check the creator’s current publication and settings.
General descriptions and classifications are recovered research. Verified details above identify the specific checks we have completed. Check the creator’s current publication for later changes.