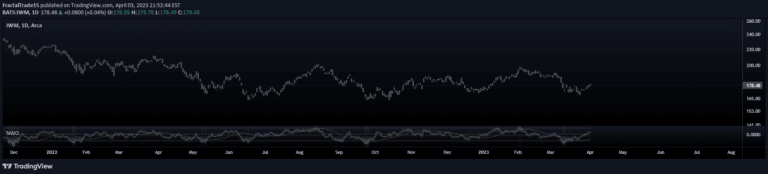
A dynamic indicator that measures price deviation from a moving average, using adaptive thresholds to identify potential overbought or oversold market conditions across different asset classes.
Explore complementary indicator rolesHow it works
The Price Deviation from MA indicator calculates the percentage difference between the current price and a selected moving average, either Simple (SMA) or Exponential (EMA). It allows traders to customize the moving average period and timeframe, providing a flexible approach to measuring price deviation.
When dynamic thresholds are enabled, the indicator automatically adjusts overbought and oversold levels based on historical price volatility. By using standard deviation calculations over a specified period, the tool creates more responsive and market-specific thresholds that adapt to changing market conditions and asset characteristics.
Why it may be useful
This indicator helps traders understand price extremes by quantifying how far the current price has moved from its historical average. By providing percentage-based deviation measurements, it offers insights into potential trend reversals and market sentiment that might not be immediately apparent from price action alone.
The adaptive nature of the dynamic thresholds makes this tool particularly valuable across different markets, from stocks and forex to cryptocurrencies and commodities. Traders can quickly identify when an asset is significantly overbought or oversold, enabling more informed decision-making and potential mean reversion trading opportunities.
When to explore it
The Price Deviation from MA indicator is most effective in markets with clear trending behavior and moderate volatility. It works exceptionally well when combined with other technical indicators like RSI, MACD, or Bollinger Bands to confirm potential trading signals and enhance market analysis.
Traders should consider using this indicator during periods of significant price movement, when seeking to identify potential trend reversals or mean reversion opportunities. It is particularly useful for traders looking to develop a comprehensive understanding of an asset's current price positioning relative to its historical performance.
Keep exploring
What we’ve verified
Access, alerts and repainting behaviour have not been independently verified for this indicator. Check the creator’s current publication and settings.
General descriptions and classifications are recovered research. Verified details above identify the specific checks we have completed. Check the creator’s current publication for later changes.