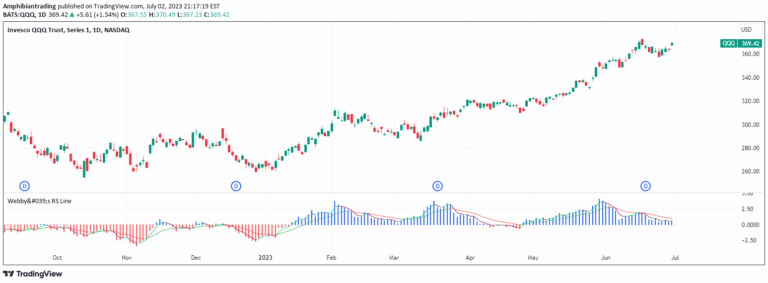
A volatility indicator measuring short-term versus long-term Average True Range using Fibonacci sequence lengths to assess potential stock breakouts or breakdowns.
Explore complementary indicator rolesHow it works
Webby's Tight Indicator calculates volatility by comparing short-term and long-term Average True Range (ATR) values using specific Fibonacci sequence lengths. The short-term ATRs are calculated using 3, 5, and 8 periods, while long-term ATRs use 55, 89, and 144 periods.
The indicator creates a ratio between these ATR values and plots the result as a histogram. When the histogram is above zero, it indicates short-term volatility is contracting relative to long-term volatility. Conversely, when the histogram is below zero, it suggests short-term volatility is expanding.
Why it may be useful
This indicator helps traders quickly visualize changes in a stock's volatility by providing a clear, color-coded representation of price action dynamics. By comparing short-term and long-term volatility, traders can identify potential trend shifts and assess market momentum more effectively.
The additional 5-day exponential moving average overlay helps filter out short-term noise and provides a smoother trend indication. This allows traders to differentiate between meaningful volatility changes and temporary market fluctuations, enhancing decision-making precision.
When to explore it
Webby's Tight Indicator is most effective when analyzing stocks experiencing potential consolidation or preparing for significant price movements. Traders can use this tool to identify periods of low volatility that might precede substantial breakouts or breakdowns in either direction.
The indicator works best in markets with clear trend potential and when combined with other technical analysis tools. It is particularly useful for traders seeking to capture momentum shifts and anticipate potential trend reversals across various timeframes and trading styles.
Keep exploring
What we’ve verified
Access, alerts and repainting behaviour have not been independently verified for this indicator. Check the creator’s current publication and settings.
General descriptions and classifications are recovered research. Verified details above identify the specific checks we have completed. Check the creator’s current publication for later changes.