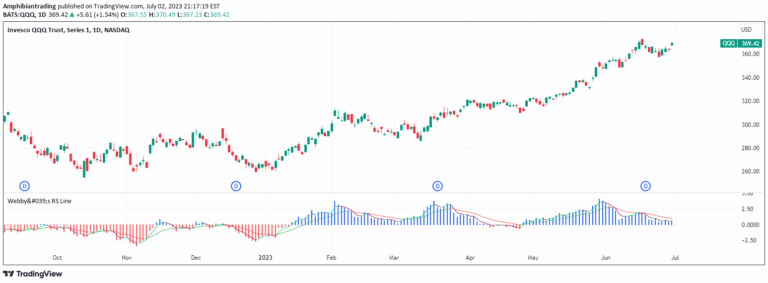
Webby's Quick & Grateful Dead RS
A trading strategy combining Relative Strength line with moving averages to identify stock performance versus the S&P 500 and detect moments of strength and weakness in price movements.
Explore 11,183 indicators. Filter beyond the obvious.
Discover the tools that fit the way you trade.
11,183 tools to explore
A trading strategy combining Relative Strength line with moving averages to identify stock performance versus the S&P 500 and detect moments of strength and weakness in price movements.
A relative strength indicator that compares a stock's performance against the S&P 500 using low prices and exponential moving averages to identify momentum shifts.
Webby's RSI 2.0 is an advanced version of the Relative Strength Index that uses a 21-day exponential moving average and 50-day ATR to measure price extension.
A volatility indicator measuring short-term versus long-term Average True Range using Fibonacci sequence lengths to assess potential stock breakouts or breakdowns.
Likes, views, and comments are historical TradingView snapshots. They describe attention, not trading performance.