
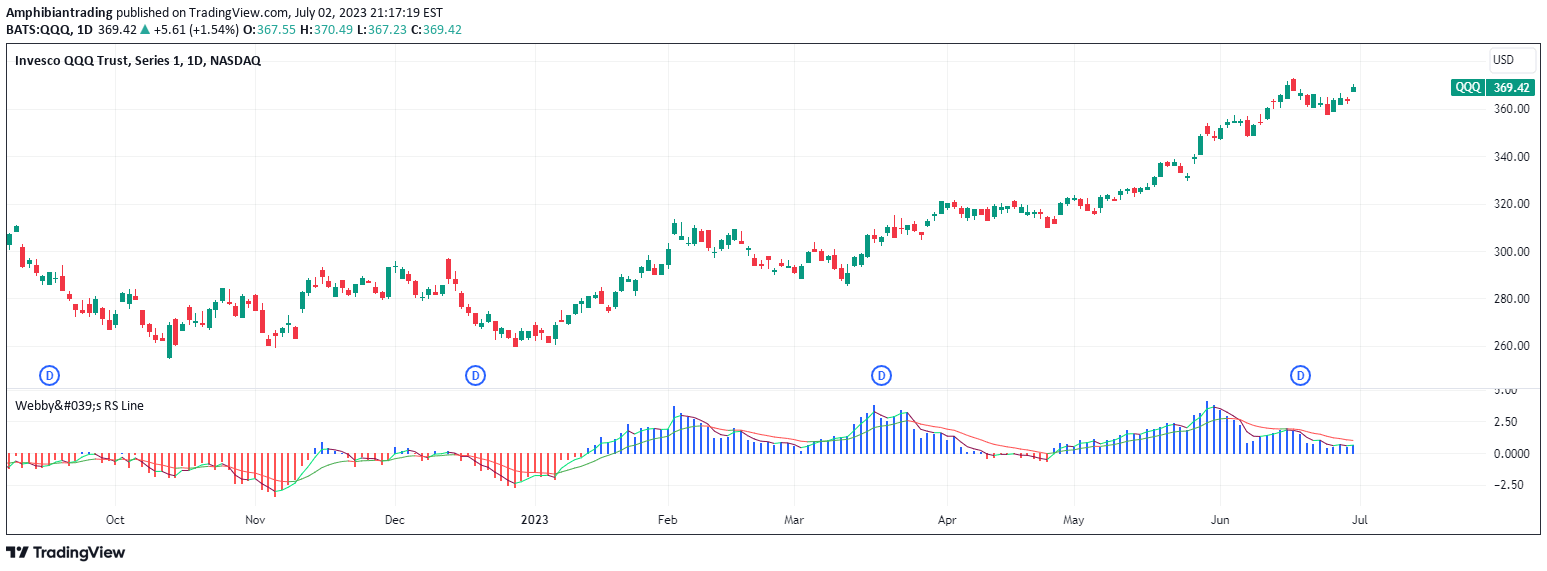
A relative strength indicator that compares a stock's performance against the S&P 500 using low prices and exponential moving averages to identify momentum shifts.
Explore complementary indicator rolesHow it works
The Relative Strength signal calculates performance by dividing a stock's low price by the S&P 500's low price, creating a unique RS line. This line is then compared against its 21-day exponential moving average (EMA), generating a histogram that visualizes the relationship.
The histogram changes colors to represent the RS line's position relative to its 21-EMA, with blue indicating outperformance and red signaling underperformance. Additional 3 and 13-day EMAs track shorter-term momentum shifts, providing traders with more nuanced insights into the stock's relative strength.
Why it may be useful
Relative strength analysis helps traders understand a stock's performance compared to the broader market, offering critical insights into potential trend strength and momentum. By measuring how a security moves in relation to the S&P 500, traders can identify stocks that are outperforming or underperforming the market.
The multi-layered approach with different EMA periods allows for more sophisticated analysis, enabling traders to capture both longer-term trends and shorter-term momentum shifts. This comprehensive view helps in making more informed trading decisions and identifying potential entry and exit points.
When to explore it
The Relative Strength signal works best during periods of clear market trends, where stocks are showing distinct performance characteristics relative to the broader market. It is particularly useful for traders seeking to identify stocks with strong momentum that are either leading or lagging the S&P 500.
Traders should consider using this indicator during trending market conditions, when sector rotations are occurring, or when looking to compare individual stock performance against the overall market. It is most effective when combined with other technical and fundamental analysis tools to confirm trading signals.
Keep exploring
What we’ve verified
Access, alerts and repainting behaviour have not been independently verified for this indicator. Check the creator’s current publication and settings.
General descriptions and classifications are recovered research. Verified details above identify the specific checks we have completed. Check the creator’s current publication for later changes.


