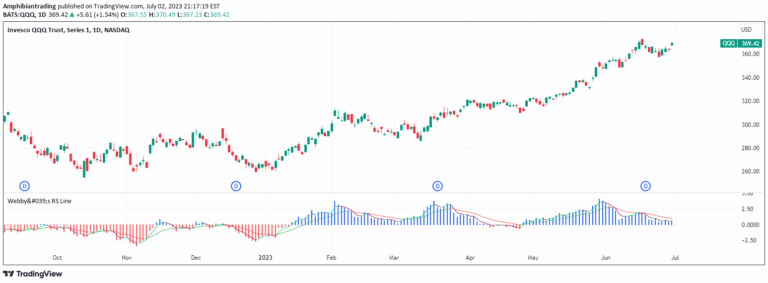
A technical indicator measuring a stock's distance from its 52-week high, helping traders assess pullback strength and potential trend continuation or reversal.
Explore complementary indicator rolesHow it works
The 52-week high distance indicator calculates the percentage a stock has pulled back from its highest price point in the last 52 weeks. It uses color-coded zones to quickly visualize the pullback magnitude: green (0-8% off highs), yellow (8-15% off highs), and red (15-25% off highs).
By tracking these zones, traders can quickly assess whether a stock's current price movement represents a typical, healthy pullback or potentially signals a more significant trend change. The indicator provides a visual representation of price movement relative to recent historical highs.
Why it may be useful
This indicator helps traders understand the context of price pullbacks by comparing current price movement to historical patterns. It provides an immediate visual cue about the stock's position relative to its recent peak, allowing traders to make more informed decisions about potential entry or exit points.
By categorizing pullbacks into different zones, the indicator helps traders distinguish between normal market fluctuations and potentially more significant trend reversals. This can be crucial in identifying whether a stock is maintaining its underlying trend or showing signs of weakening momentum.
When to explore it
The 52-week high distance indicator is most effective during trending markets where stocks are experiencing periodic pullbacks. It works best when used in conjunction with other technical analysis tools to confirm potential trade setups or trend continuations.
Traders should pay special attention when a stock moves into the yellow or red zones, as these may indicate increased likelihood of trend change or need for closer monitoring. It's particularly useful for swing traders and day traders looking to understand the broader context of a stock's recent price movement.
Keep exploring
What we’ve verified
Access, alerts and repainting behaviour have not been independently verified for this indicator. Check the creator’s current publication and settings.
General descriptions and classifications are recovered research. Verified details above identify the specific checks we have completed. Check the creator’s current publication for later changes.