YOUR INDICATOR RESEARCH STARTS HERE

Find the right indicator.
Understand what it does.

Explore 11,183 indicators. Filter beyond the obvious.
Discover the tools that fit the way you trade.

THE INDICATOR LIBRARY

Results for “webby”

11,183 tools to explore

10 indicators matching your filters
Save search
FundamentalSignalTrend

Analytics Trading Dashboard

by Amphibiantrading

A comprehensive trading dashboard that aggregates critical company information, fundamental data, price metrics, and analyst ratings into a single, easy-to-view analytical tool.

Main price chart · unverifiedDay Trading · Swing Trading
Explore
590likes11.1Kviews12comments
Save
TrendMomentumSignal

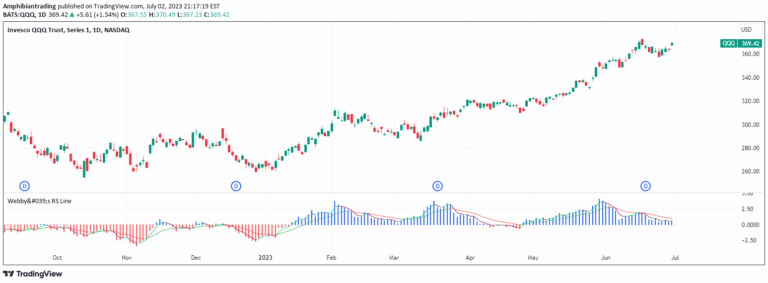
Webby's RS Line

by Amphibiantrading

A relative strength indicator that compares a stock's performance against the S&P 500 using low prices and exponential moving averages to identify momentum shifts.

Separate pane · unverifiedDay Trading · Swing Trading
Explore
422likes8.6Kviews10comments
Save
LevelsSignalTrend

Webby % Off 52 Week

by Amphibiantrading

A technical indicator measuring a stock's distance from its 52-week high, helping traders assess pullback strength and potential trend continuation or reversal.

Main price chart · unverifiedDay Trading · Swing Trading
Explore
409likes6.5Kviews9comments
Save
TrendSignal

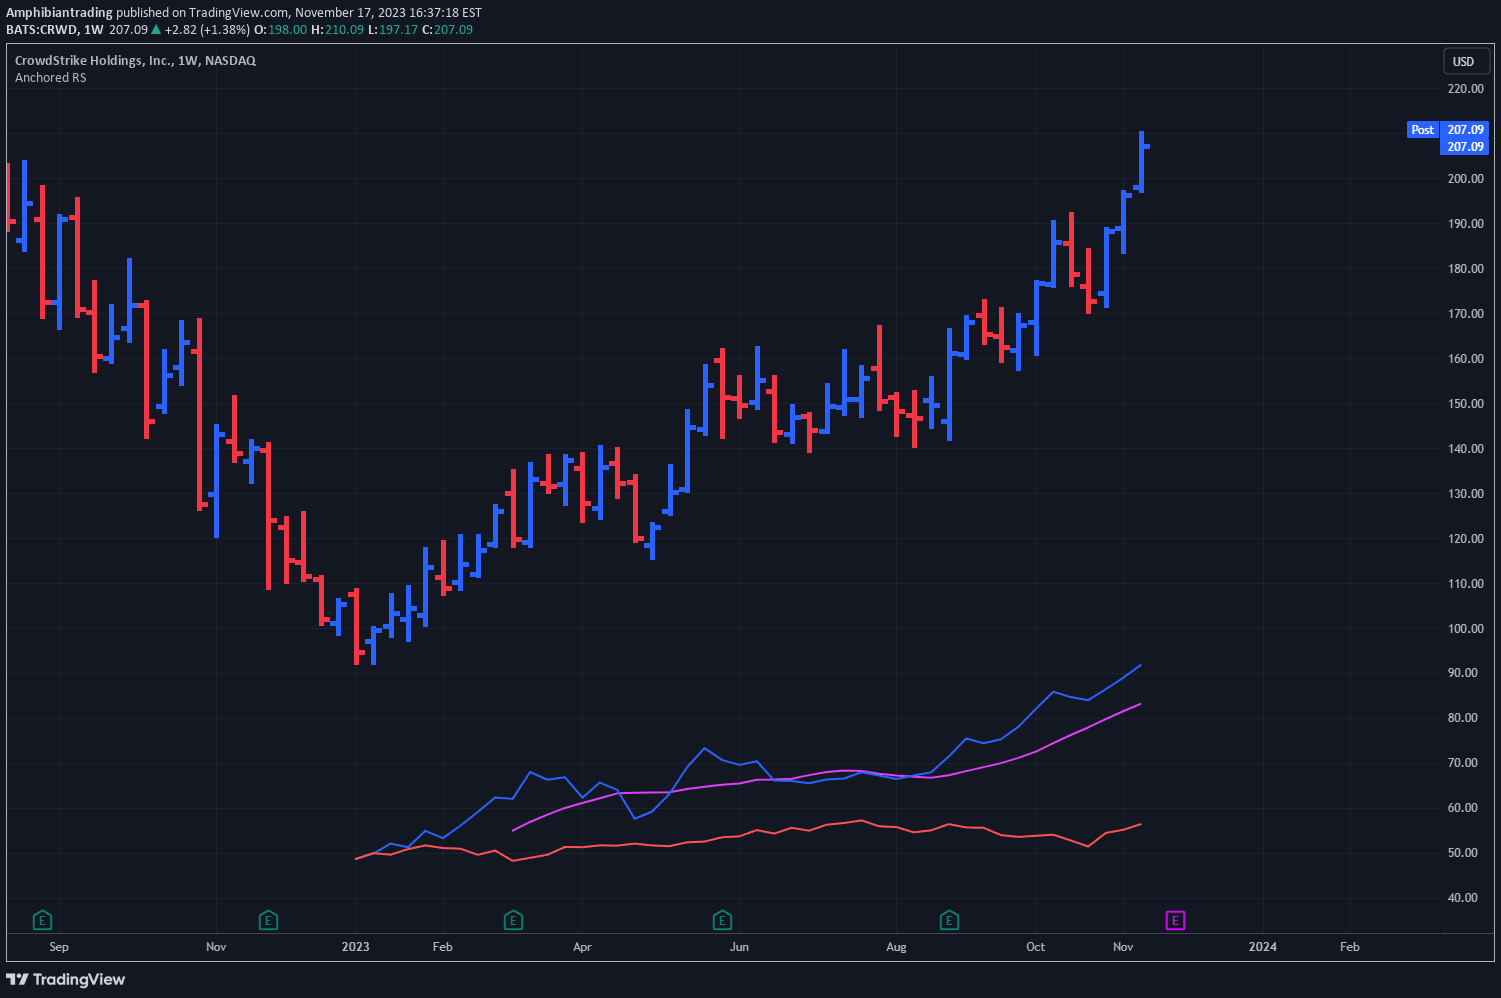
Anchored Relative Strength

by Amphibiantrading

A customizable Relative Strength indicator that compares a stock's performance against a benchmark index from a specific anchor point, enabling targeted performance analysis.

Separate pane · unverifiedDay Trading · Swing Trading
Explore
404likes5.9Kviews10comments
Save
MomentumTrendVolatility

Webby's RSI 2.0

by Amphibiantrading

Webby's RSI 2.0 is an advanced version of the Relative Strength Index that uses a 21-day exponential moving average and 50-day ATR to measure price extension.

Separate pane · unverifiedScalping · Day Trading
Explore
399likes8Kviews8comments
Save
OscillatorTrendVolatility

Webby's Tight Indicator

by Amphibiantrading

A volatility indicator measuring short-term versus long-term Average True Range using Fibonacci sequence lengths to assess potential stock breakouts or breakdowns.

Separate pane · unverifiedScalping · Day Trading
Explore
370likes6.3Kviews0comments
Save
SignalTrend

Power Outage

by Amphibiantrading

The Power Outage indicator identifies market downtrends by tracking specific price and moving average conditions, signaling potential weakness and opportunities for defensive trading strategies.

Main price chart · unverifiedSwing Trading
Explore
161likes3Kviews2comments
Save
SignalTrend

Webby's Market Order

by starshiptrade

A market order indicator that identifies potential trend direction by analyzing three consecutive lows or highs in relation to the 21 EMA. Helps traders anticipate uptrends and downtrends on major indices.

Main price chart · unverifiedScalping · Day Trading
Explore
19likes608views0comments
Save

Likes, views, and comments are historical TradingView snapshots. They describe attention, not trading performance.

START WITH A QUESTION

A little less searching.
A lot more understanding.

Tell DeepAlpha what you need. Get an explanation, a shortlist,
and a direct path to the indicators behind it.

Ask DeepAlpha