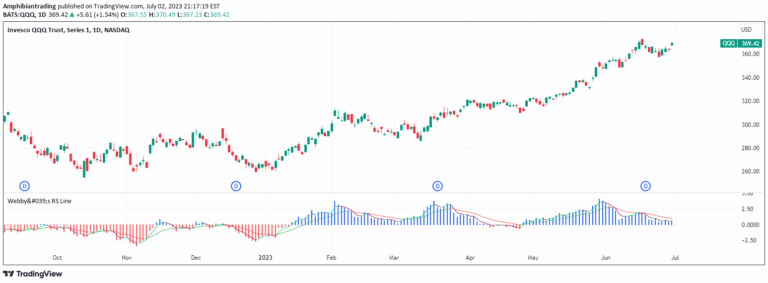
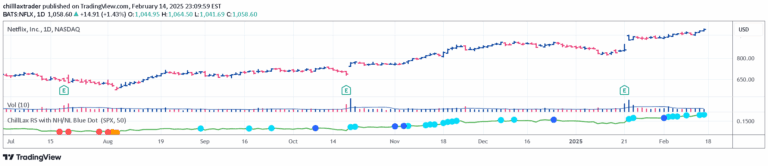
A customizable Relative Strength indicator that compares a stock's performance against a benchmark index from a specific anchor point, enabling targeted performance analysis.
Explore complementary indicator rolesHow it works
The Anchored Relative Strength (RS) Indicator calculates performance by dividing the close price of a selected stock by the close price of a comparative symbol, typically an index like SPX. This calculation starts from a user-defined anchor date, allowing traders to measure performance from a specific historical event or market condition.
By providing a dynamic starting point, the indicator enables traders to analyze relative strength across different market phases. Users can easily adjust the anchor point by clicking and dragging, making it a flexible tool for comparing securities' performance against a benchmark over customizable time periods.
Why it may be useful
The Anchored RS Indicator provides traders with a nuanced method of evaluating securities' performance relative to a market benchmark. By allowing comparison from a specific date, it helps identify sustained outperformance or underperformance, which can reveal underlying market dynamics and potential trading opportunities.
This approach gives traders a more targeted view of relative strength, moving beyond traditional static comparisons. The ability to anchor the analysis to specific events like earnings reports, market peaks, or significant trend changes allows for more contextual and meaningful performance assessment.
When to explore it
The Anchored RS Indicator is most effective when analyzing performance during specific market periods or after significant events that might impact a security's trajectory. Traders can use it to evaluate how a stock has performed relative to an index following earnings releases, major market shifts, or other pivotal moments.
It is particularly useful for swing traders and day traders seeking to understand a security's strength within a defined timeframe. By comparing performance from a custom anchor point, traders can make more informed decisions about potential entry and exit points, as well as assess the overall health and momentum of a particular investment.
Keep exploring
What we’ve verified
Access, alerts and repainting behaviour have not been independently verified for this indicator. Check the creator’s current publication and settings.
General descriptions and classifications are recovered research. Verified details above identify the specific checks we have completed. Check the creator’s current publication for later changes.