Liquidity Sentiment Profile (Auto-Anchored) [LuxAlgo]
An advanced charting tool measuring liquidity and market sentiment by analyzing price and volume data across different anchoring periods to reveal significant trading levels.
Explore 11,183 indicators. Filter beyond the obvious.
Discover the tools that fit the way you trade.
11,183 tools to explore
An advanced charting tool measuring liquidity and market sentiment by analyzing price and volume data across different anchoring periods to reveal significant trading levels.
An anchored supply and demand indicator that allows traders to manually select price range zones to analyze volume distribution and potential support/resistance levels.
Advanced volume profile indicator offering high-resolution analysis of trading volume across multiple range modes, providing traders with detailed insights into market structure and price-volume relationships.
An innovative trading signal that fits an Archimedean spiral to price action, allowing traders to visualize price movement through a unique geometric representation with customizable parameters.
Machine learning indicator using Gaussian Process Regression to estimate market trends and forecast future price movements by analyzing historical price data between two selected anchor points.
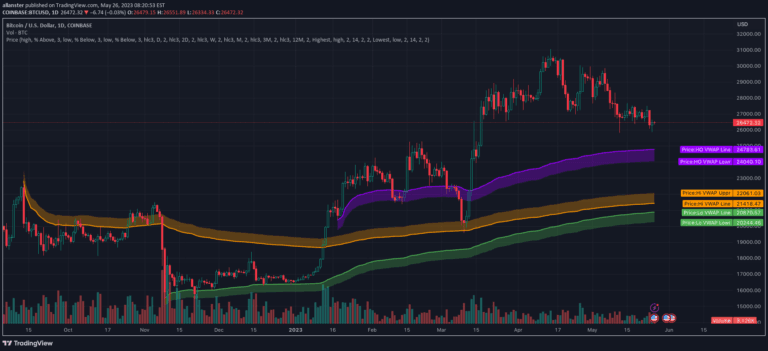
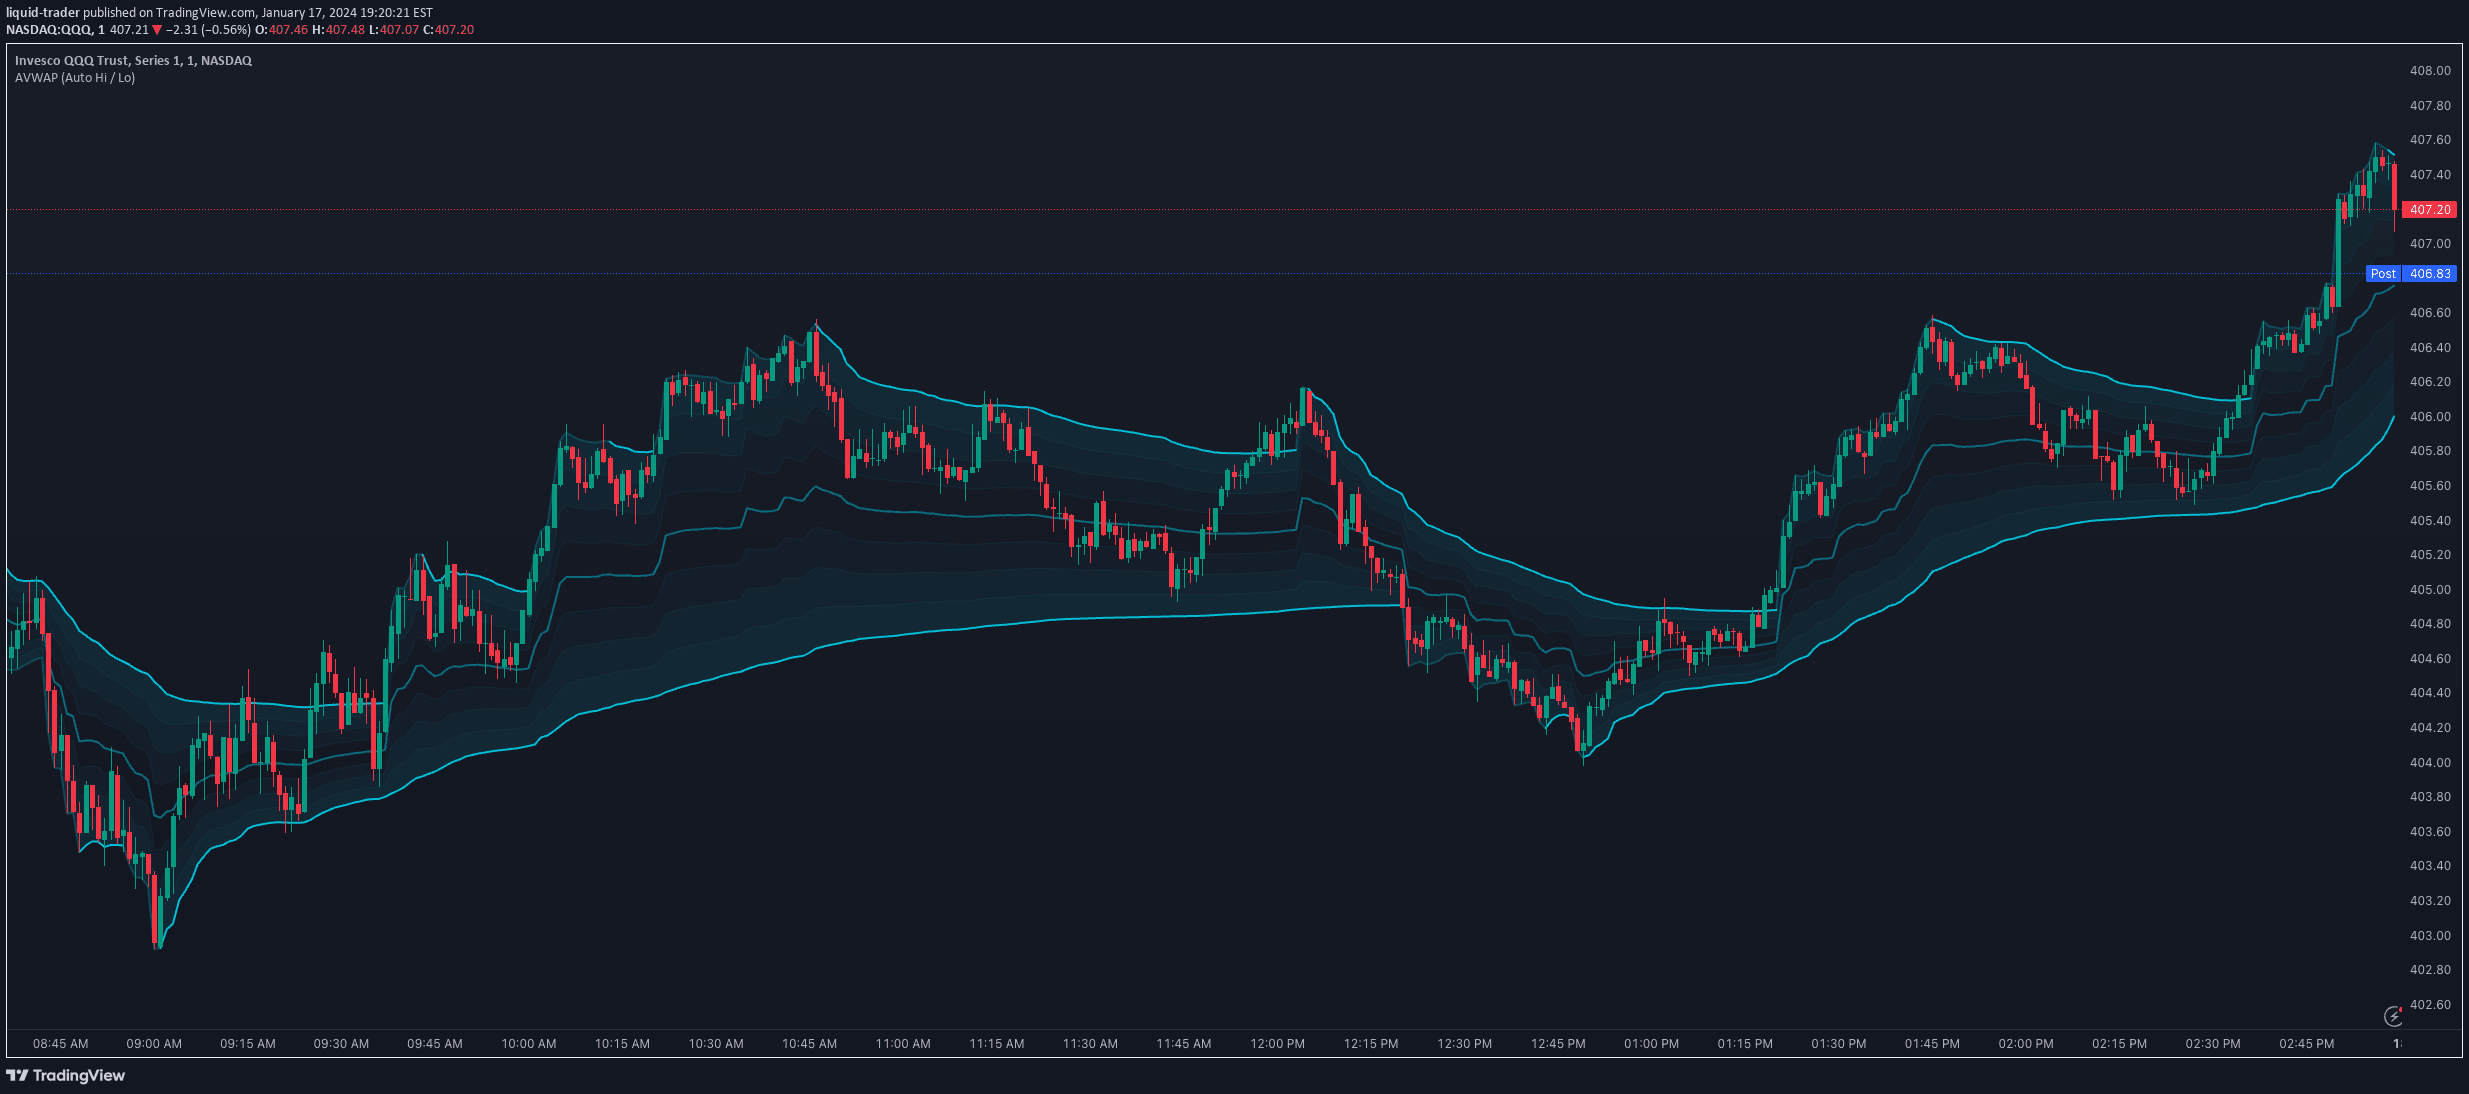
An advanced VWAP toolbox that provides multiple anchored VWAP techniques, including pinch and handoff strategies, periodic intervals, and automatic anchor selection for technical analysis.
Advanced volume mapping tool revealing institutional trading activity, volume distribution, and fair value drift across price ranges with dynamic zone analysis.
The Anchored Monte Carlo Shuffled Projection tool simulates potential future price points by randomly shuffling historical bar movements from a user-defined anchor point.
Rolling VWAP Channel creates a dynamic indicator using multiple Volume Weighted Average Prices to analyze price clusters and potential market directional changes through percentile interpolation.
A multi-anchored linear regression channel tool that uses advanced statistical techniques to analyze price trends, offering flexible regression and deviation calculations across multiple customizable channels.
The Anchored Powered KAMA is an advanced adaptive moving average that uses multiple anchor periods and a power exponent to filter market trends and volatility more effectively.
A multi-anchored VWAP indicator plotting three volume-weighted average price lines to help traders identify market trends, mean reversion, and potential breakout points.
Likes, views, and comments are historical TradingView snapshots. They describe attention, not trading performance.