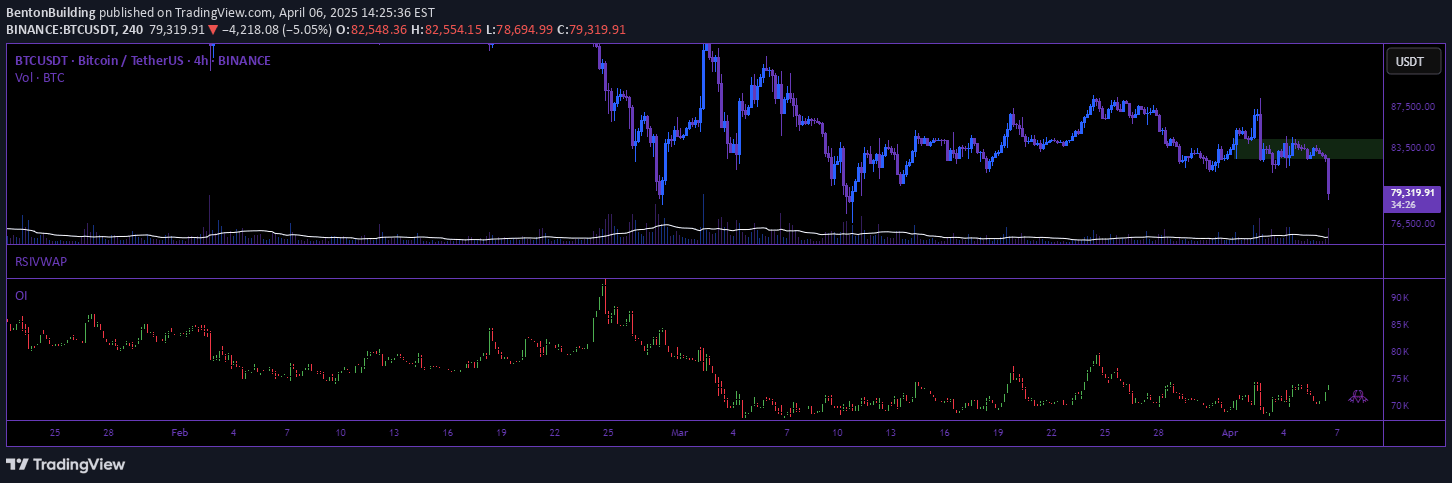
Advanced volume mapping tool revealing institutional trading activity, volume distribution, and fair value drift across price ranges with dynamic zone analysis.
Explore complementary indicator rolesHow it works
The Volume Range Profile dynamically calculates volume zones anchored at the highest and lowest price points within a lookback period. These zones are divided into multiple volume bins, each representing the trading volume at specific price levels, with the Point of Control (POC) highlighting the most traded price level.
The tool further distinguishes volume by categorizing each bin into buy and sell volumes based on candle close prices. It tracks the evolution of these volume distributions, creating a fair value drift line that changes color to indicate rising or falling market sentiment, providing a real-time visualization of institutional trading activity.
Why it may be useful
This volume analysis tool offers traders deep insights into market dynamics by revealing where institutional traders are most active and how volume is distributed across price ranges. By breaking down volume into buy and sell components, traders can understand the underlying market sentiment and potential future price movements.
The fair value drift line and volume zone analysis help traders identify key support and resistance levels, detect accumulation or distribution patterns, and make more informed trading decisions based on volume behavior and market equilibrium.
When to explore it
The Volume Range Profile is most effective in markets with significant institutional participation and clear volume trends, such as major forex pairs, stock indices, and liquid commodities. Traders can use this tool to identify potential entry and exit points by observing volume concentration and fair value shifts during trending or ranging market conditions.
It is particularly useful when analyzing market structure, detecting potential trend reversals, and understanding the balance of buying and selling pressure at critical price levels. Traders can leverage this tool across multiple timeframes to gain a comprehensive view of market dynamics and institutional trading behavior.
Keep exploring
What we’ve verified
Access, alerts and repainting behaviour have not been independently verified for this indicator. Check the creator’s current publication and settings.
General descriptions and classifications are recovered research. Verified details above identify the specific checks we have completed. Check the creator’s current publication for later changes.