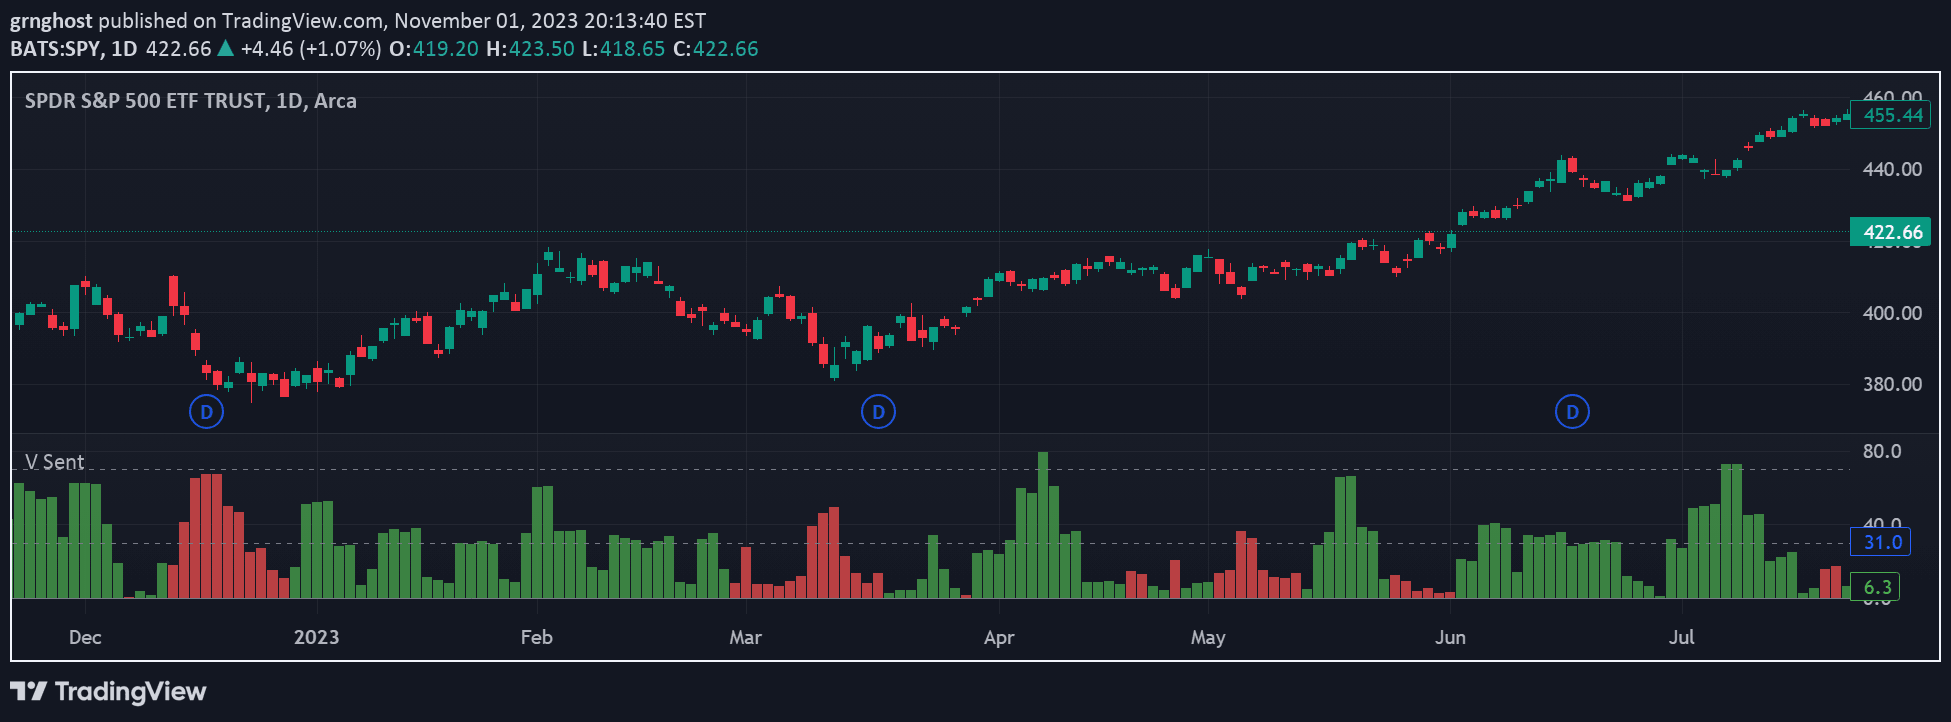
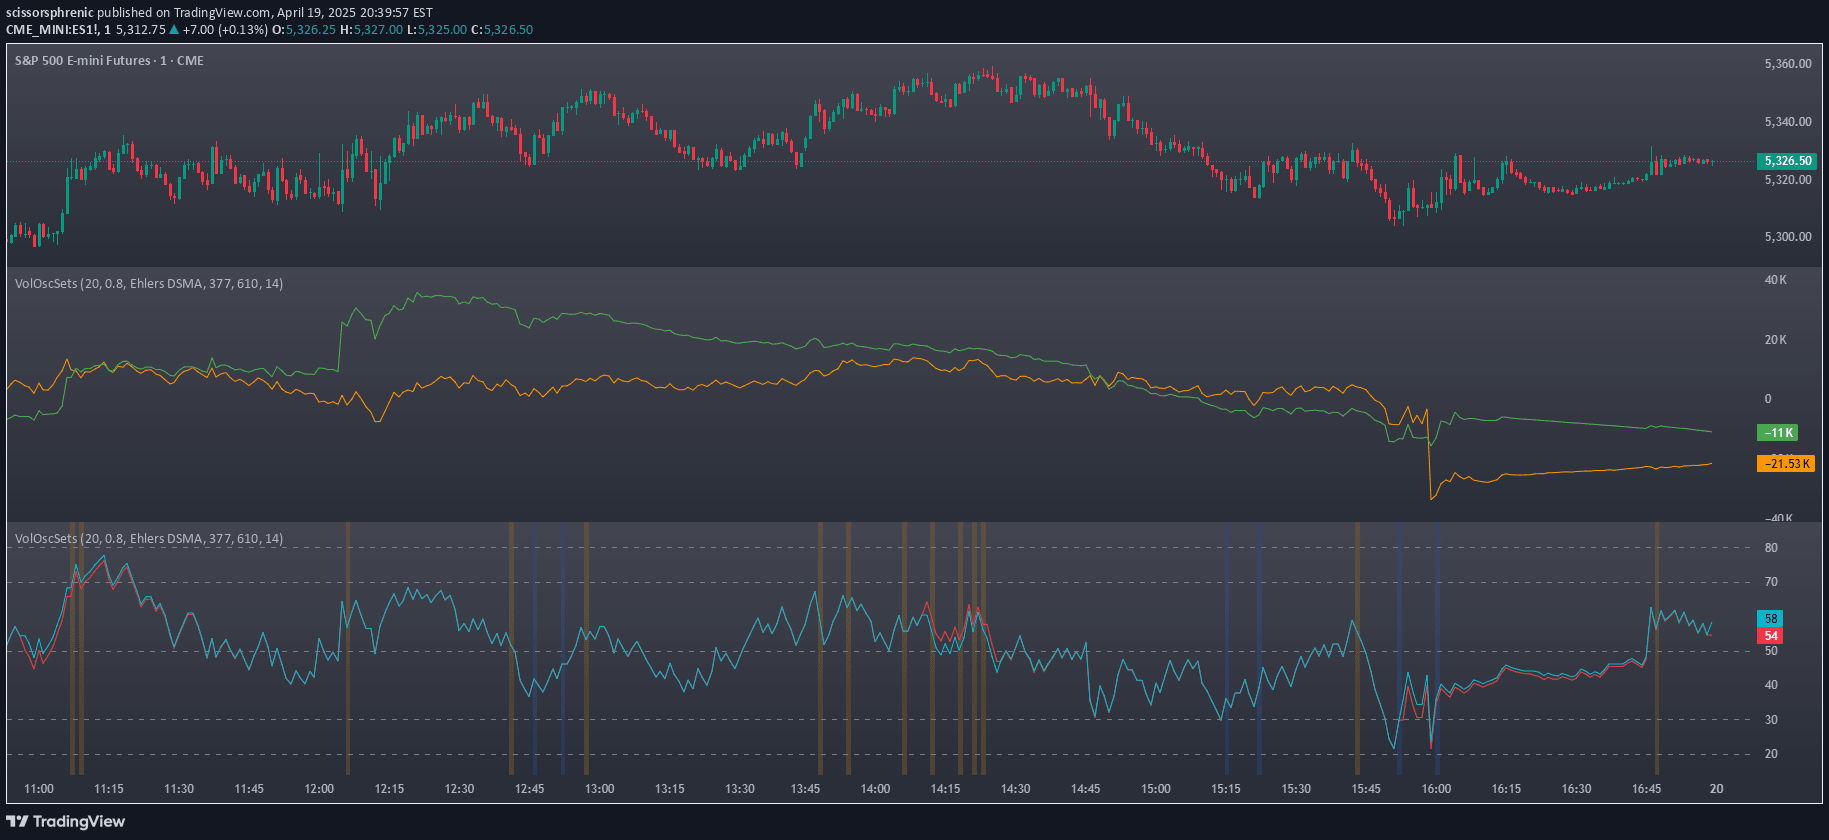
A volume delta indicator that visualizes buying and selling volume through color-coded candlesticks with customizable settings and a minimum volume threshold filter.
Explore complementary indicator rolesHow it works
The Volume Delta indicator calculates the difference between buying and selling volume for each price bar, creating color-coded visualizations that represent market activity. Green candles indicate buying volume dominance, while red candles show selling volume dominance, providing a clear representation of market sentiment.
Users can customize the indicator by setting a minimum delta volume threshold, which helps filter out insignificant volume changes and focus on meaningful market movements. The indicator also allows for flexible timeframe selection and supports adjusting moving average periods and standard deviation multipliers to refine delta calculations.
Why it may be useful
Volume delta provides critical insights into market dynamics by revealing the underlying strength of price movements through volume analysis. By distinguishing between buying and selling pressure, traders can better understand potential trend reversals, market sentiment, and the conviction behind price actions.
The customizable nature of this indicator allows traders to adapt it to their specific trading style and strategy, making it a versatile tool for analyzing market activity. Its ability to filter out noise and focus on significant volume changes helps traders make more informed decisions by highlighting meaningful market movements.
When to explore it
The Volume Delta indicator is most effective when used in markets with significant volume and clear trading activity, such as major stock indices, forex pairs, and liquid commodities. It works particularly well during periods of market volatility, where volume changes can provide early signals of potential trend shifts or momentum changes.
Traders can leverage this indicator across different timeframes, from scalping on minute charts to swing trading on daily or weekly charts. By combining volume delta analysis with other technical indicators, traders can develop more robust trading strategies and improve their market entry and exit timing.
Keep exploring
What we’ve verified
Access, alerts and repainting behaviour have not been independently verified for this indicator. Check the creator’s current publication and settings.
General descriptions and classifications are recovered research. Verified details above identify the specific checks we have completed. Check the creator’s current publication for later changes.