
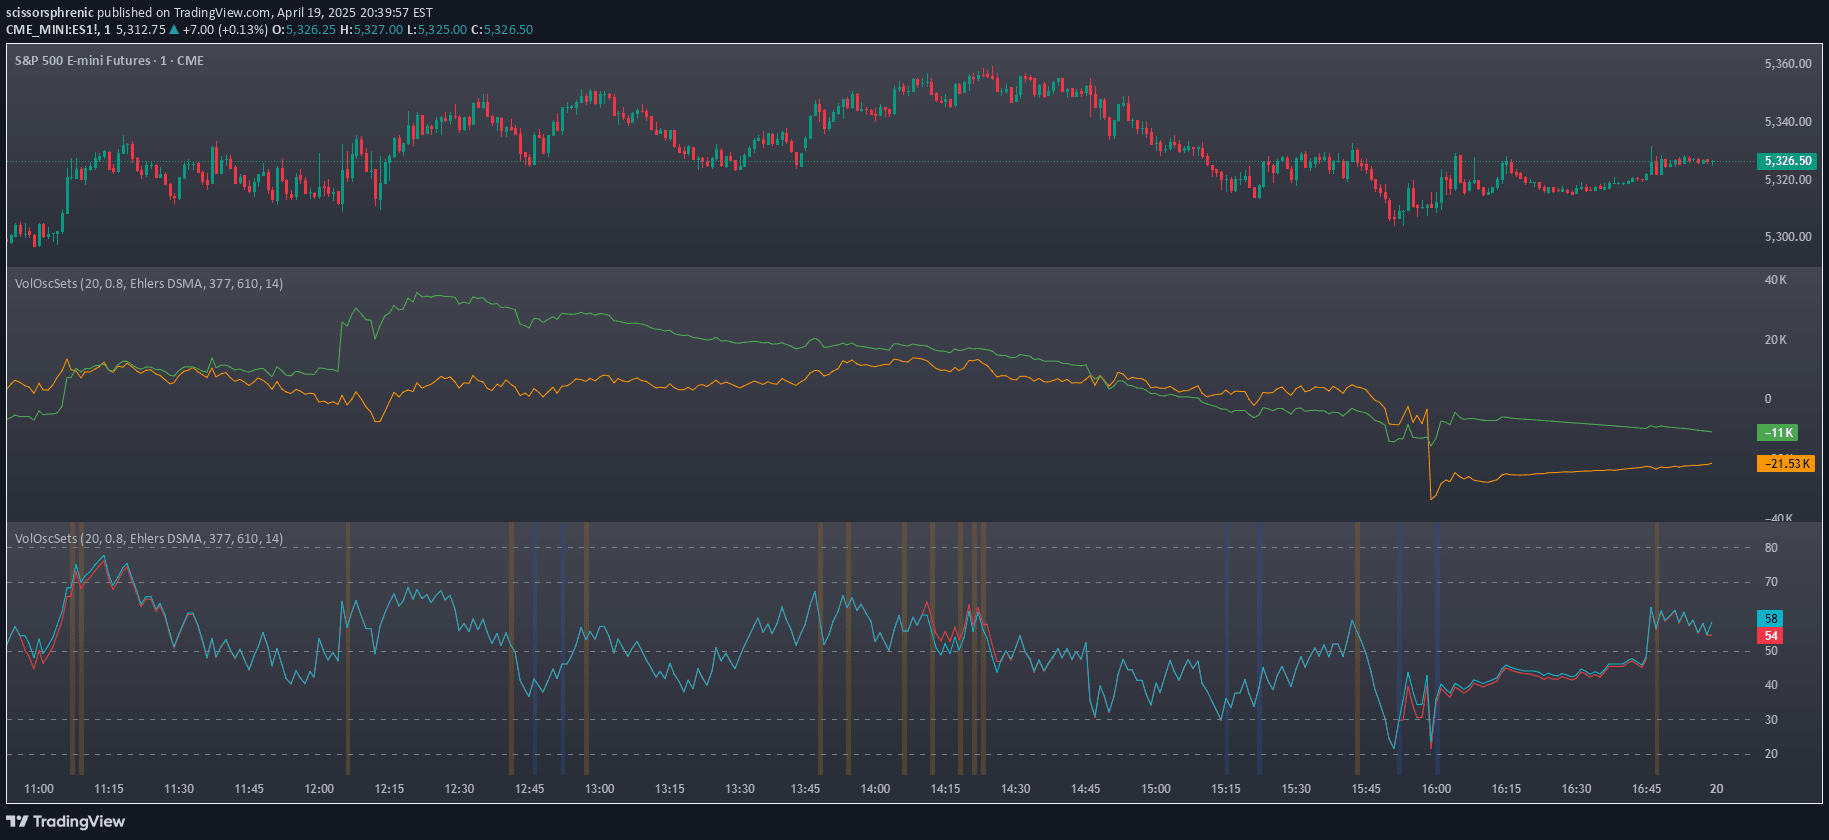
A unique indicator combining On Balance Volume and Accumulation/Distribution as an oscillator with customizable moving averages for trend analysis and trading signals.
Explore complementary indicator rolesHow it works
This indicator blends On Balance Volume (OBV) and Accumulation/Distribution (A/D) line into a single oscillator, utilizing advanced moving average techniques. It employs three customizable moving average types: Ehlers Deviation Scaled Moving Average, Volatility Dynamic Moving Average, and Simple Moving Average, allowing traders to adapt the indicator to different market conditions.
The default configuration uses a longer 377-period Ehlers DSMA to capture the standard OBV and A/D view, with an additional overlay of a shorter-period Volatility Dynamic Moving Average using Average True Range. This approach creates a sophisticated oscillator that can provide nuanced insights into volume and price momentum.
Why it may be useful
By combining volume-based indicators into a single oscillator, this tool offers traders a more comprehensive view of market dynamics and potential price movements. The customizable moving averages allow for flexible analysis across different market conditions, making it a versatile tool for understanding market sentiment and potential trend changes.
The ability to overlay multiple moving average types with different periods provides traders with a more robust and adaptable signal generation mechanism. This approach helps traders identify potential entry and exit points by integrating volume, trend, and momentum information into a single, easily interpretable indicator.
When to explore it
This indicator works best in markets with clear volume trends and when traders want a more nuanced view of price momentum and volume dynamics. It is particularly effective in markets with significant price volatility, where traditional volume indicators might provide limited insights.
Traders should consider using this indicator during periods of market transition, such as potential trend reversals or consolidation phases. The multiple moving average overlays make it especially useful for confirming trend strength, identifying potential breakouts, and assessing the underlying volume-driven market sentiment.
Keep exploring
What we’ve verified
Access, alerts and repainting behaviour have not been independently verified for this indicator. Check the creator’s current publication and settings.
General descriptions and classifications are recovered research. Verified details above identify the specific checks we have completed. Check the creator’s current publication for later changes.


