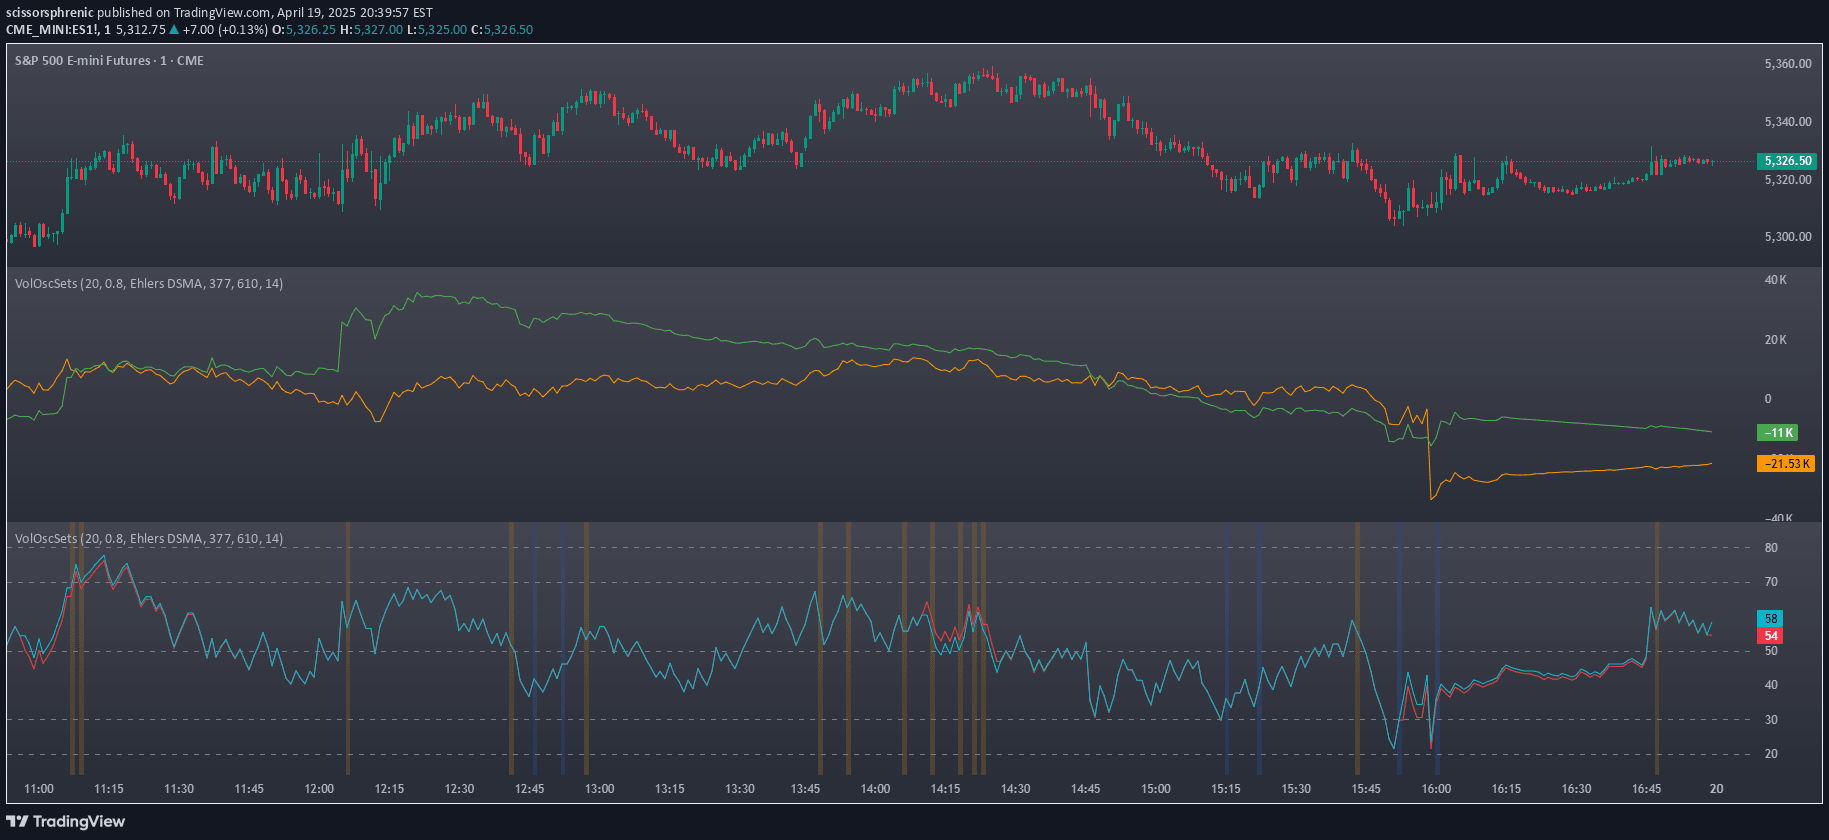
The OBVAD Ribbon is an advanced volume indicator using 11 DEMA periods to analyze cumulative volume data, helping traders visualize market dynamics and potential trend changes.
Explore complementary indicator rolesHow it works
The OBVAD Ribbon applies 11 Double Exponential Moving Averages (DEMA) to a unique volume calculation formula developed by SpaceTrader. This formula combines volume with price action, creating a cumulative sum that reveals underlying market momentum. The ribbon calculates volume using a complex formula: volume*(close-open)/( high-low )*hlc3, which provides a more responsive interpretation of market volume.
When plotted, the ribbon changes colors to indicate trend direction, turning blue in an uptrend and purple in a downtrend. Traders can identify potential trend changes and reversals by observing the ribbon's color shifts and the positioning of its multiple moving average lines.
Why it may be useful
The OBVAD Ribbon offers traders a sophisticated tool for understanding market volume dynamics beyond traditional volume indicators. By integrating multiple DEMA periods, it provides a more nuanced view of market momentum and potential trend reversals. This approach allows traders to gain deeper insights into market sentiment and potential price movements.
Unlike standard volume indicators, the OBVAD Ribbon's unique formula and color-coded system make it easier to interpret complex market information. Traders can quickly identify trend strength, potential reversals, and underlying market psychology, which can significantly improve decision-making and trading strategy development.
When to explore it
The OBVAD Ribbon is most effective when used across multiple timeframes, providing versatile insights for different trading styles. It works particularly well in markets with clear trending characteristics, helping traders identify and confirm trend directions. Traders should pay special attention to color changes and divergences, which can signal potential trend reversals or momentum shifts.
Ideal application includes using the OBVAD Ribbon in conjunction with other technical analysis tools like support/resistance levels and price action patterns. It is especially useful during periods of market volatility, where volume and momentum indicators can provide critical insights into potential market movements and trader sentiment.
Keep exploring
What we’ve verified
Access, alerts and repainting behaviour have not been independently verified for this indicator. Check the creator’s current publication and settings.
General descriptions and classifications are recovered research. Verified details above identify the specific checks we have completed. Check the creator’s current publication for later changes.