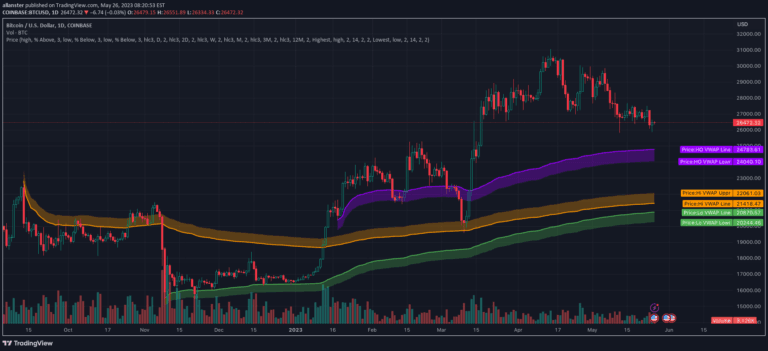
A multi-anchored VWAP indicator plotting three volume-weighted average price lines to help traders identify market trends, mean reversion, and potential breakout points.
Explore complementary indicator rolesHow it works
The script generates three distinct Volume Weighted Average Price (VWAP) lines: a traditional VWAP, a VWAP anchored to a trend's high point, and another anchored to a trend's low point. Each VWAP calculates the cumulative price multiplied by volume divided by total volume, providing a weighted average price that reflects trading activity and market sentiment.
The anchored VWAPs offer additional context by using specific reference points like trend highs and lows, which allows traders to understand price movements relative to key market moments. By configuring plot sizes, colors, and visibility, traders can customize the indicator to suit their specific trading style and preferences.
Why it may be useful
VWAP is a critical tool used by institutional traders and market makers to execute large trades and understand market dynamics. By tracking volume-weighted price levels, traders can gain insights into institutional trading activity and potential market trends that might not be visible through traditional price charts.
The multi-anchored approach provides a more nuanced view of price movement, helping traders identify potential trend reversals, mean reversion points, and breakout opportunities. Understanding these volume-weighted price levels can improve trade entry and exit decisions, especially for day traders seeking to align their strategies with broader market movements.
When to explore it
This indicator is most effective on intraday time frames like 1-minute or 5-minute charts, which are typically used for day trading. It is particularly useful in liquid markets with significant trading volume where institutional trading activity plays a substantial role in price movement.
Traders should focus on using this tool during active market hours when volume is highest, such as during market opens, after economic announcements, or during periods of increased market volatility. It is less suitable for longer-term timeframes like hourly or daily charts, which are more commonly used in swing trading strategies.
Keep exploring
What we’ve verified
Access, alerts and repainting behaviour have not been independently verified for this indicator. Check the creator’s current publication and settings.
General descriptions and classifications are recovered research. Verified details above identify the specific checks we have completed. Check the creator’s current publication for later changes.