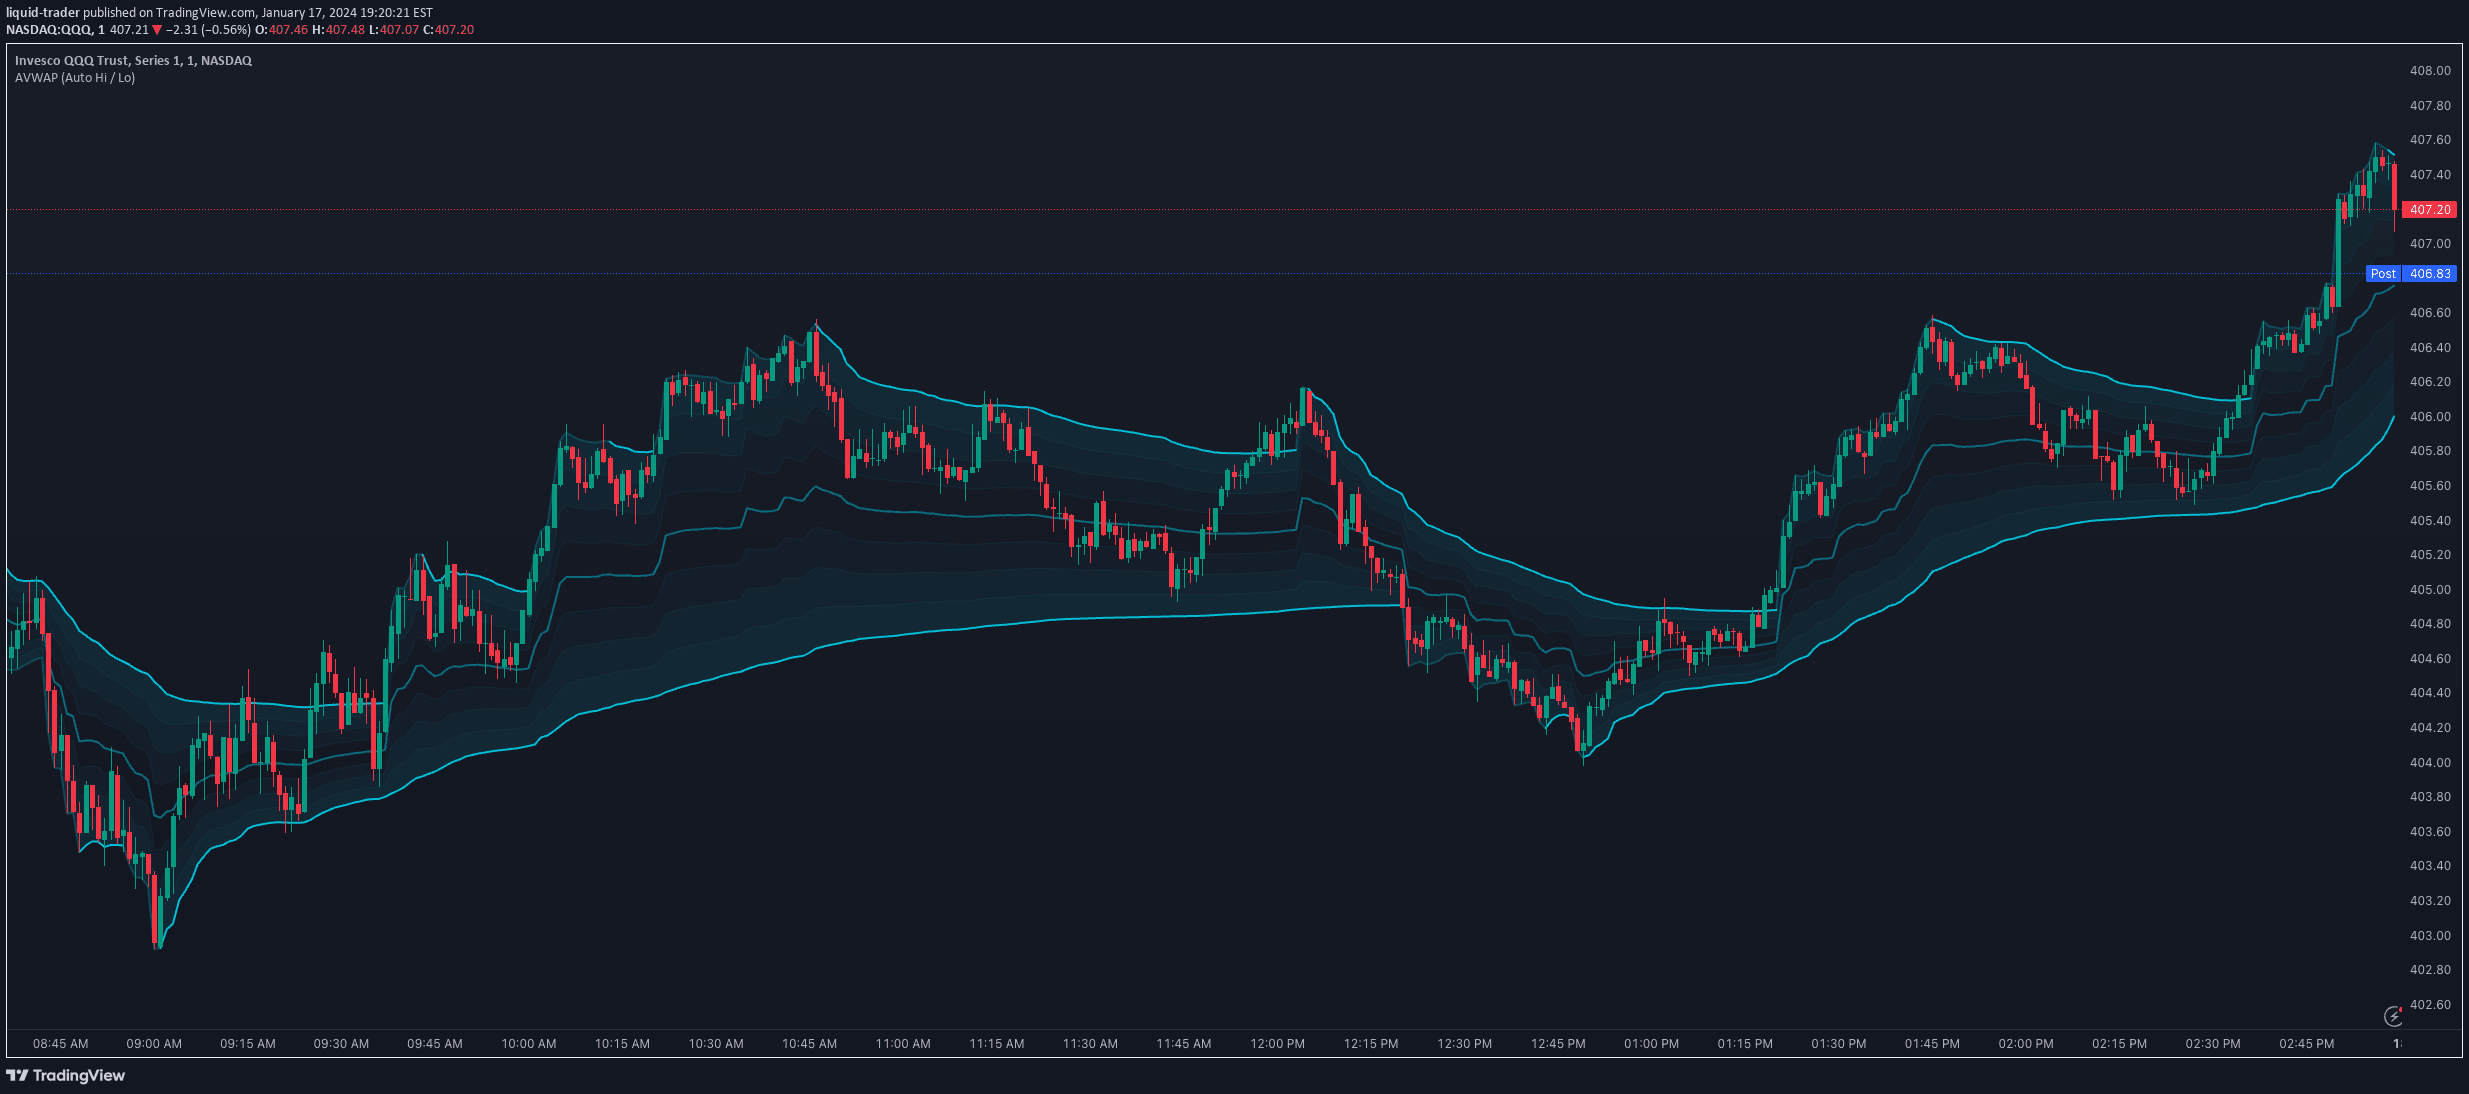
VWAP Fibonacci Bands (Zeiierman)
A sophisticated trading indicator that combines MIDAS methodology, volume-weighted average price, standard deviation bands, and Fibonacci levels to analyze market trends and potential price movements.
Explore 11,183 indicators. Filter beyond the obvious.
Discover the tools that fit the way you trade.
11,183 tools to explore
A sophisticated trading indicator that combines MIDAS methodology, volume-weighted average price, standard deviation bands, and Fibonacci levels to analyze market trends and potential price movements.
A multi-anchored VWAP indicator plotting three volume-weighted average price lines to help traders identify market trends, mean reversion, and potential breakout points.
A dynamic trading indicator that combines Rolling Volume Weighted Average Price (VWAP) with Discrete Fourier Transform for advanced harmonic analysis and trend identification.
A trading indicator that generates buy and sell arrows using VWAP, moving averages, and RSI to help traders identify potential market entry and exit points.
A volume weighted average price (VWAP) indicator that allows traders to anchor and customize price analysis across multiple timeframes and periods with configurable settings.
An advanced trading indicator that identifies consolidation periods and anchors three unique VWAPs to key price points, helping traders analyze volume-weighted average prices during market pauses.
Aggregated VWAP combines Volume Weighted Average Price from multiple exchanges, allowing traders to compare and analyze price dynamics across different trading platforms.
VWAP calculates the volume-weighted average price, helping traders understand price trends by integrating trading volume and price data across a specific time frame.
A technical analysis strategy combining VWAP and Bollinger Bands to identify potential trend breakouts and assess price momentum in intraday trading.
A volume-weighted average price (VWAP) indicator for futures and forex that resets at the beginning of each session with configurable timeframes and standard deviation bands.
VWAP is a volume-weighted average price indicator that smooths price data and provides trend insights by analyzing price movement relative to trading volume.
A flexible multi-timeframe moving average indicator that allows traders to display up to 24 moving averages across 5 timeframes with customizable settings and preset configurations.
Likes, views, and comments are historical TradingView snapshots. They describe attention, not trading performance.