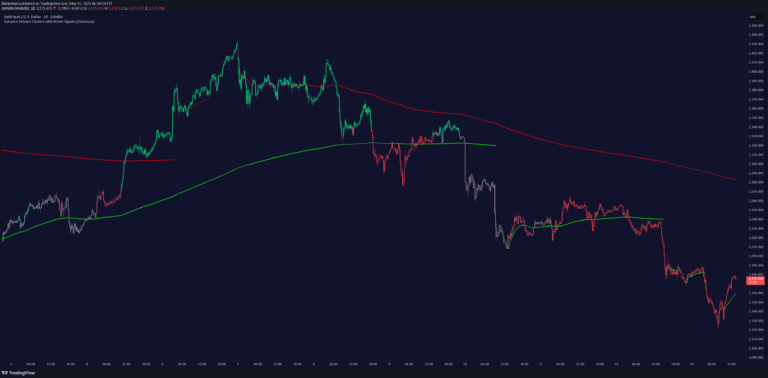
A trading indicator that generates buy and sell arrows using VWAP, moving averages, and RSI to help traders identify potential market entry and exit points.
Explore complementary indicator rolesHow it works
The indicator combines multiple technical analysis tools to generate trading signals. It uses two moving averages (20 and 50 periods) to identify trend changes and potential crossover points in price movement. The system also incorporates VWAP to assess price relative to volume and RSI to measure momentum and potential overbought or oversold conditions.
When the moving averages cross in a specific pattern, the indicator plots buy or sell arrows on the chart. These arrows are further confirmed by checking the relationship with VWAP and the RSI level, which helps filter out potentially false signals and improve the reliability of the trading recommendations.
Why it may be useful
Technical indicators like this provide traders with systematic approaches to identifying potential trading opportunities. By combining multiple indicators, the signal reduces the likelihood of making decisions based on emotional responses or single-metric analysis. The visual arrows make it easier for traders to quickly understand potential entry and exit points without complex manual calculations.
The multi-indicator approach allows traders to gain a more comprehensive view of market conditions. By integrating trend, volume, and momentum indicators, traders can make more informed decisions and potentially improve their trading strategy's overall effectiveness and risk management.
When to explore it
This indicator is most effective in markets with clear trending characteristics and moderate volatility. It works particularly well for traders who prefer systematic, rule-based trading approaches and want visual confirmation of potential trade setups. The combination of moving averages, VWAP, and RSI makes it suitable for short to medium-term trading strategies.
Traders should use this indicator in conjunction with other analysis tools and risk management techniques. It is most beneficial in liquid markets with consistent price movements, such as major stock indices, forex pairs, and actively traded commodities. Implementing proper stop-loss and take-profit strategies can help maximize the indicator's potential.
Keep exploring
What we’ve verified
Access, alerts and repainting behaviour have not been independently verified for this indicator. Check the creator’s current publication and settings.
General descriptions and classifications are recovered research. Verified details above identify the specific checks we have completed. Check the creator’s current publication for later changes.