Fibo Levels with Volume Profile and Targets [ChartPrime]
A trading tool that combines Fibonacci levels with volume profile analysis to provide insights into potential price movements and trading volume distribution across key market levels.
Explore 11,183 indicators. Filter beyond the obvious.
Discover the tools that fit the way you trade.
11,183 tools to explore
A trading tool that combines Fibonacci levels with volume profile analysis to provide insights into potential price movements and trading volume distribution across key market levels.
A trading signal that identifies potential stock breakouts by analyzing percentage price change and volume, using specific conditions to highlight trading opportunities.
A precision trading tool that combines linear regression channels with volume profile analysis, revealing trend direction and volume concentration for strategic market insights.
A scalping indicator using multiple candlestick patterns to identify high-probability trading opportunities across different timeframes with minimal indicator reliance.
A trading indicator that generates buy and sell arrows using VWAP, moving averages, and RSI to help traders identify potential market entry and exit points.
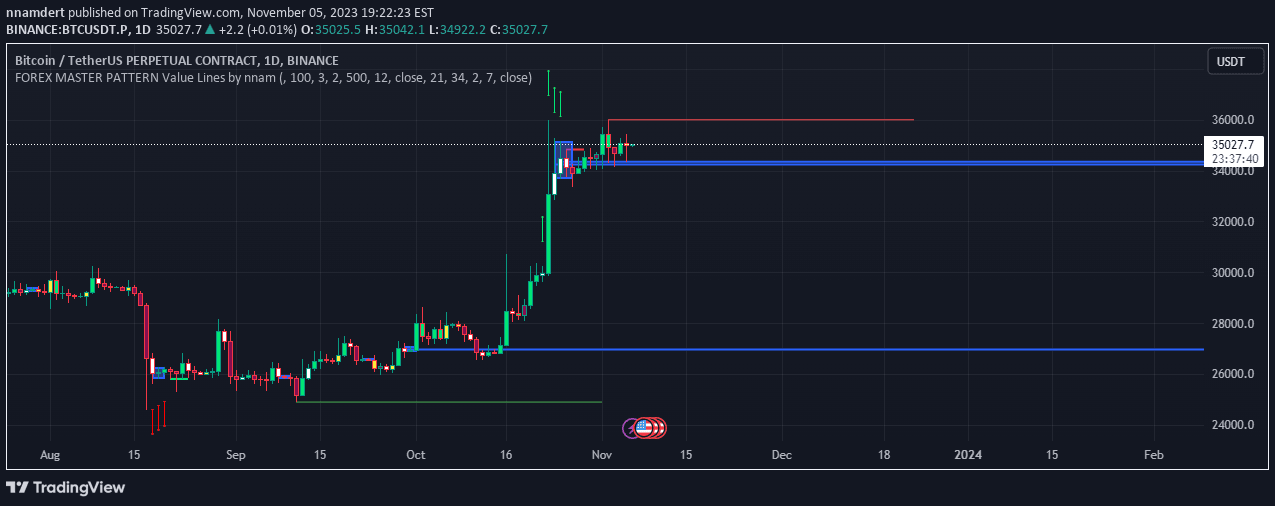
A Forex technical analysis tool that identifies hidden price patterns and contraction points, helping traders spot potential market movements and institutional trading strategies.
A momentum analysis tool tracking Price Momentum Oscillator (PMO) with clear visual signals. Identifies potential trend reversals through custom smoothing and crossover indicators.
Strong Pullback Indicator uses RSI and candlestick patterns to identify potential trend reversals and pullbacks across multiple timeframes with customizable settings.
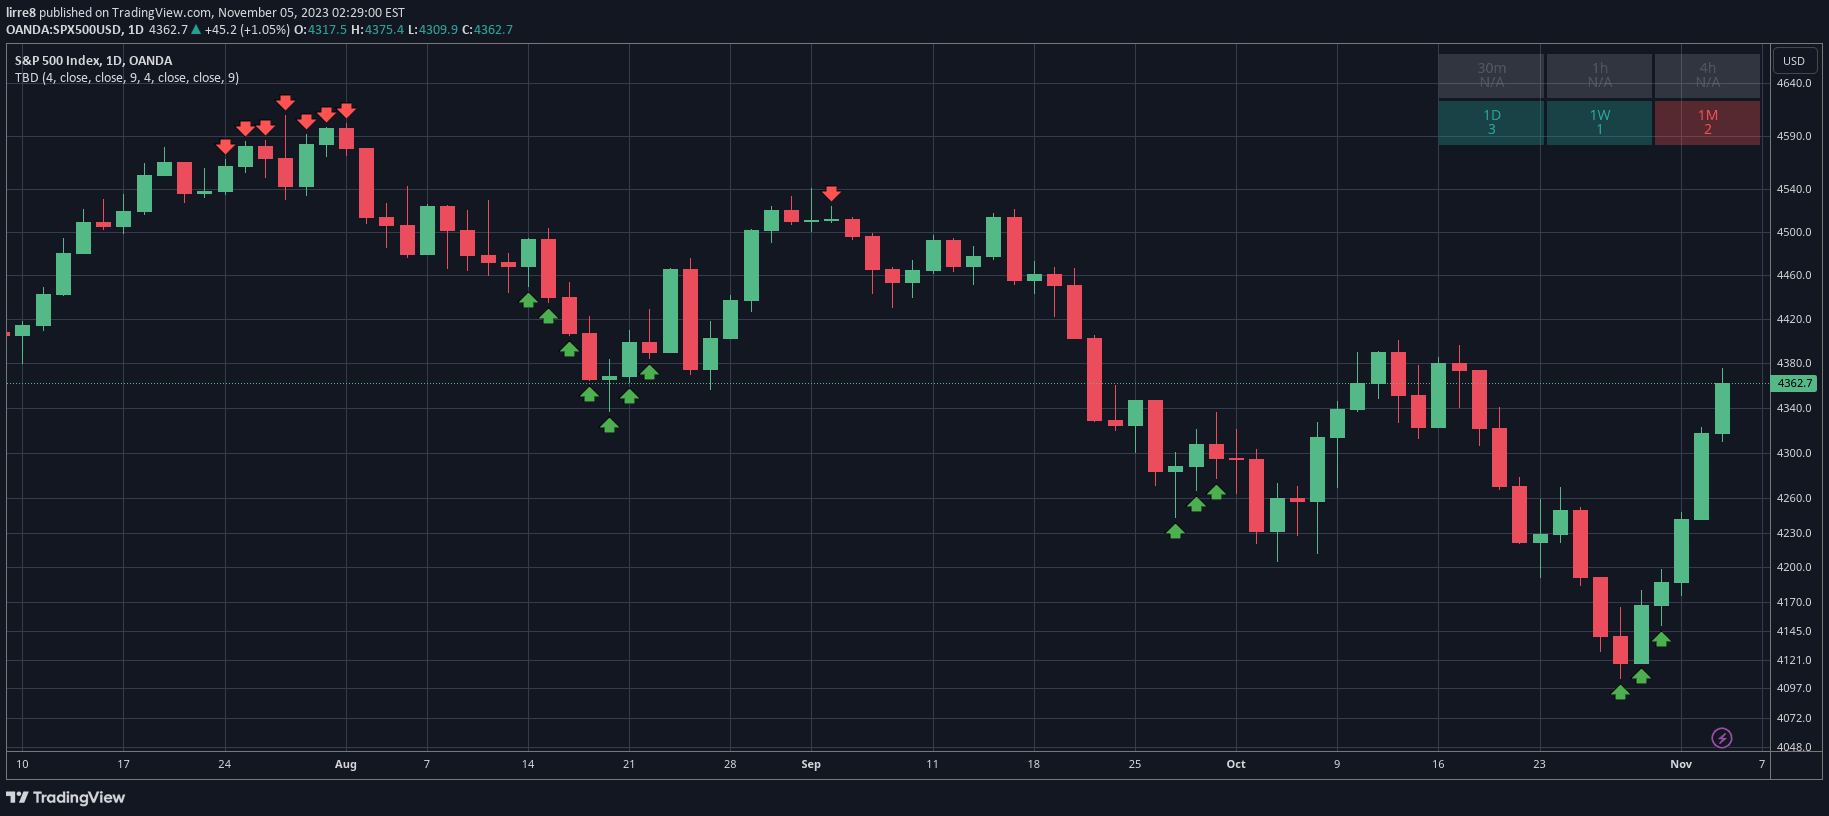
A trading indicator that detects potential market tops and bottoms by counting consecutive candles based on price comparison and predefined criteria across multiple timeframes.
PSP is a technical analysis tool comparing price action across three tickers to identify market desynchronization and potential trading opportunities based on price structure divergences.
A trading strategy focused on identifying panic selling and buying opportunities across multiple symbols, providing real-time alerts and visual signals for potential market reversals.
A volume-based indicator that identifies potential market reversals and breakouts by analyzing price action and trading volume using customizable parameters and alert mechanisms.
Likes, views, and comments are historical TradingView snapshots. They describe attention, not trading performance.